<meta> Methods

Keywords:
big data, openFrameworks, api, Met Museum, performance art
Github:
https://github.com/reginaflores/ofxMetAPI
Description:
Set Theory is a branch of mathematics that studies sets or the collection of objects. This project, <META>Methods, is concerned with making sense of Big Data by applying set theory to the cataloging and the creating of collections of information. When the world is viewed as a massive network, everything can be viewed as a data point, but also, when that data is collected, it becomes and can be viewed as part of a set. And what is inherent in any data point is the metadata that defines it and links it to subsets and supersets. <META>Methods is a research endeavor in algorithmic art using mathematical modeling of data in the programming language C++ in OpenFrameworks (OF). Using the Metropolitan Museum of Art’s (the Met’s) digital archive as a data set, the project also explores the idea of the museum as a medium and the potential for museum objects, collected together as a set, to be seen as a standalone body of work.
With a background in astrophysics and mathematics, I draw constant inspiration from the concept of data and data processing. For my entire career I have, in one way or another, looked at Big Data, from historical interest rate fluctuations and their correlation to currency prices to radio frequency signals in galaxy clusters. I am fascinated by Big Data and the stories that can emerge from the process of analysis. By researching this field in the context of creative coding, these mathematical methods take on a new dimension. Statistical analysis can have new meanings and interpretations – ones that are intensely interpersonal and emotional.

<META>Methods sits at the intersection of art and mathematics. Using two algorithms, a network topological structure and a Kohonen Self Organizing Feature Maps (SOM) model, I attempt to discover connections between the objects in the Met’s digital collection, which is a data set consisting of about half a million art-objects spanning 5,000 years of human history. In order to accomplish this, I wrote a piece of software (add-on) in OF called ofxMetAPI that uses the Met’s API to pull data into the OF tool-kit. While the core output of this project is a body of work that is an exploration of my own personal artistic expression, the underlying software I wrote has, for the first time, given the global community of creative coders access to this data set (it is publicly available and on the OF add-ons webpage).
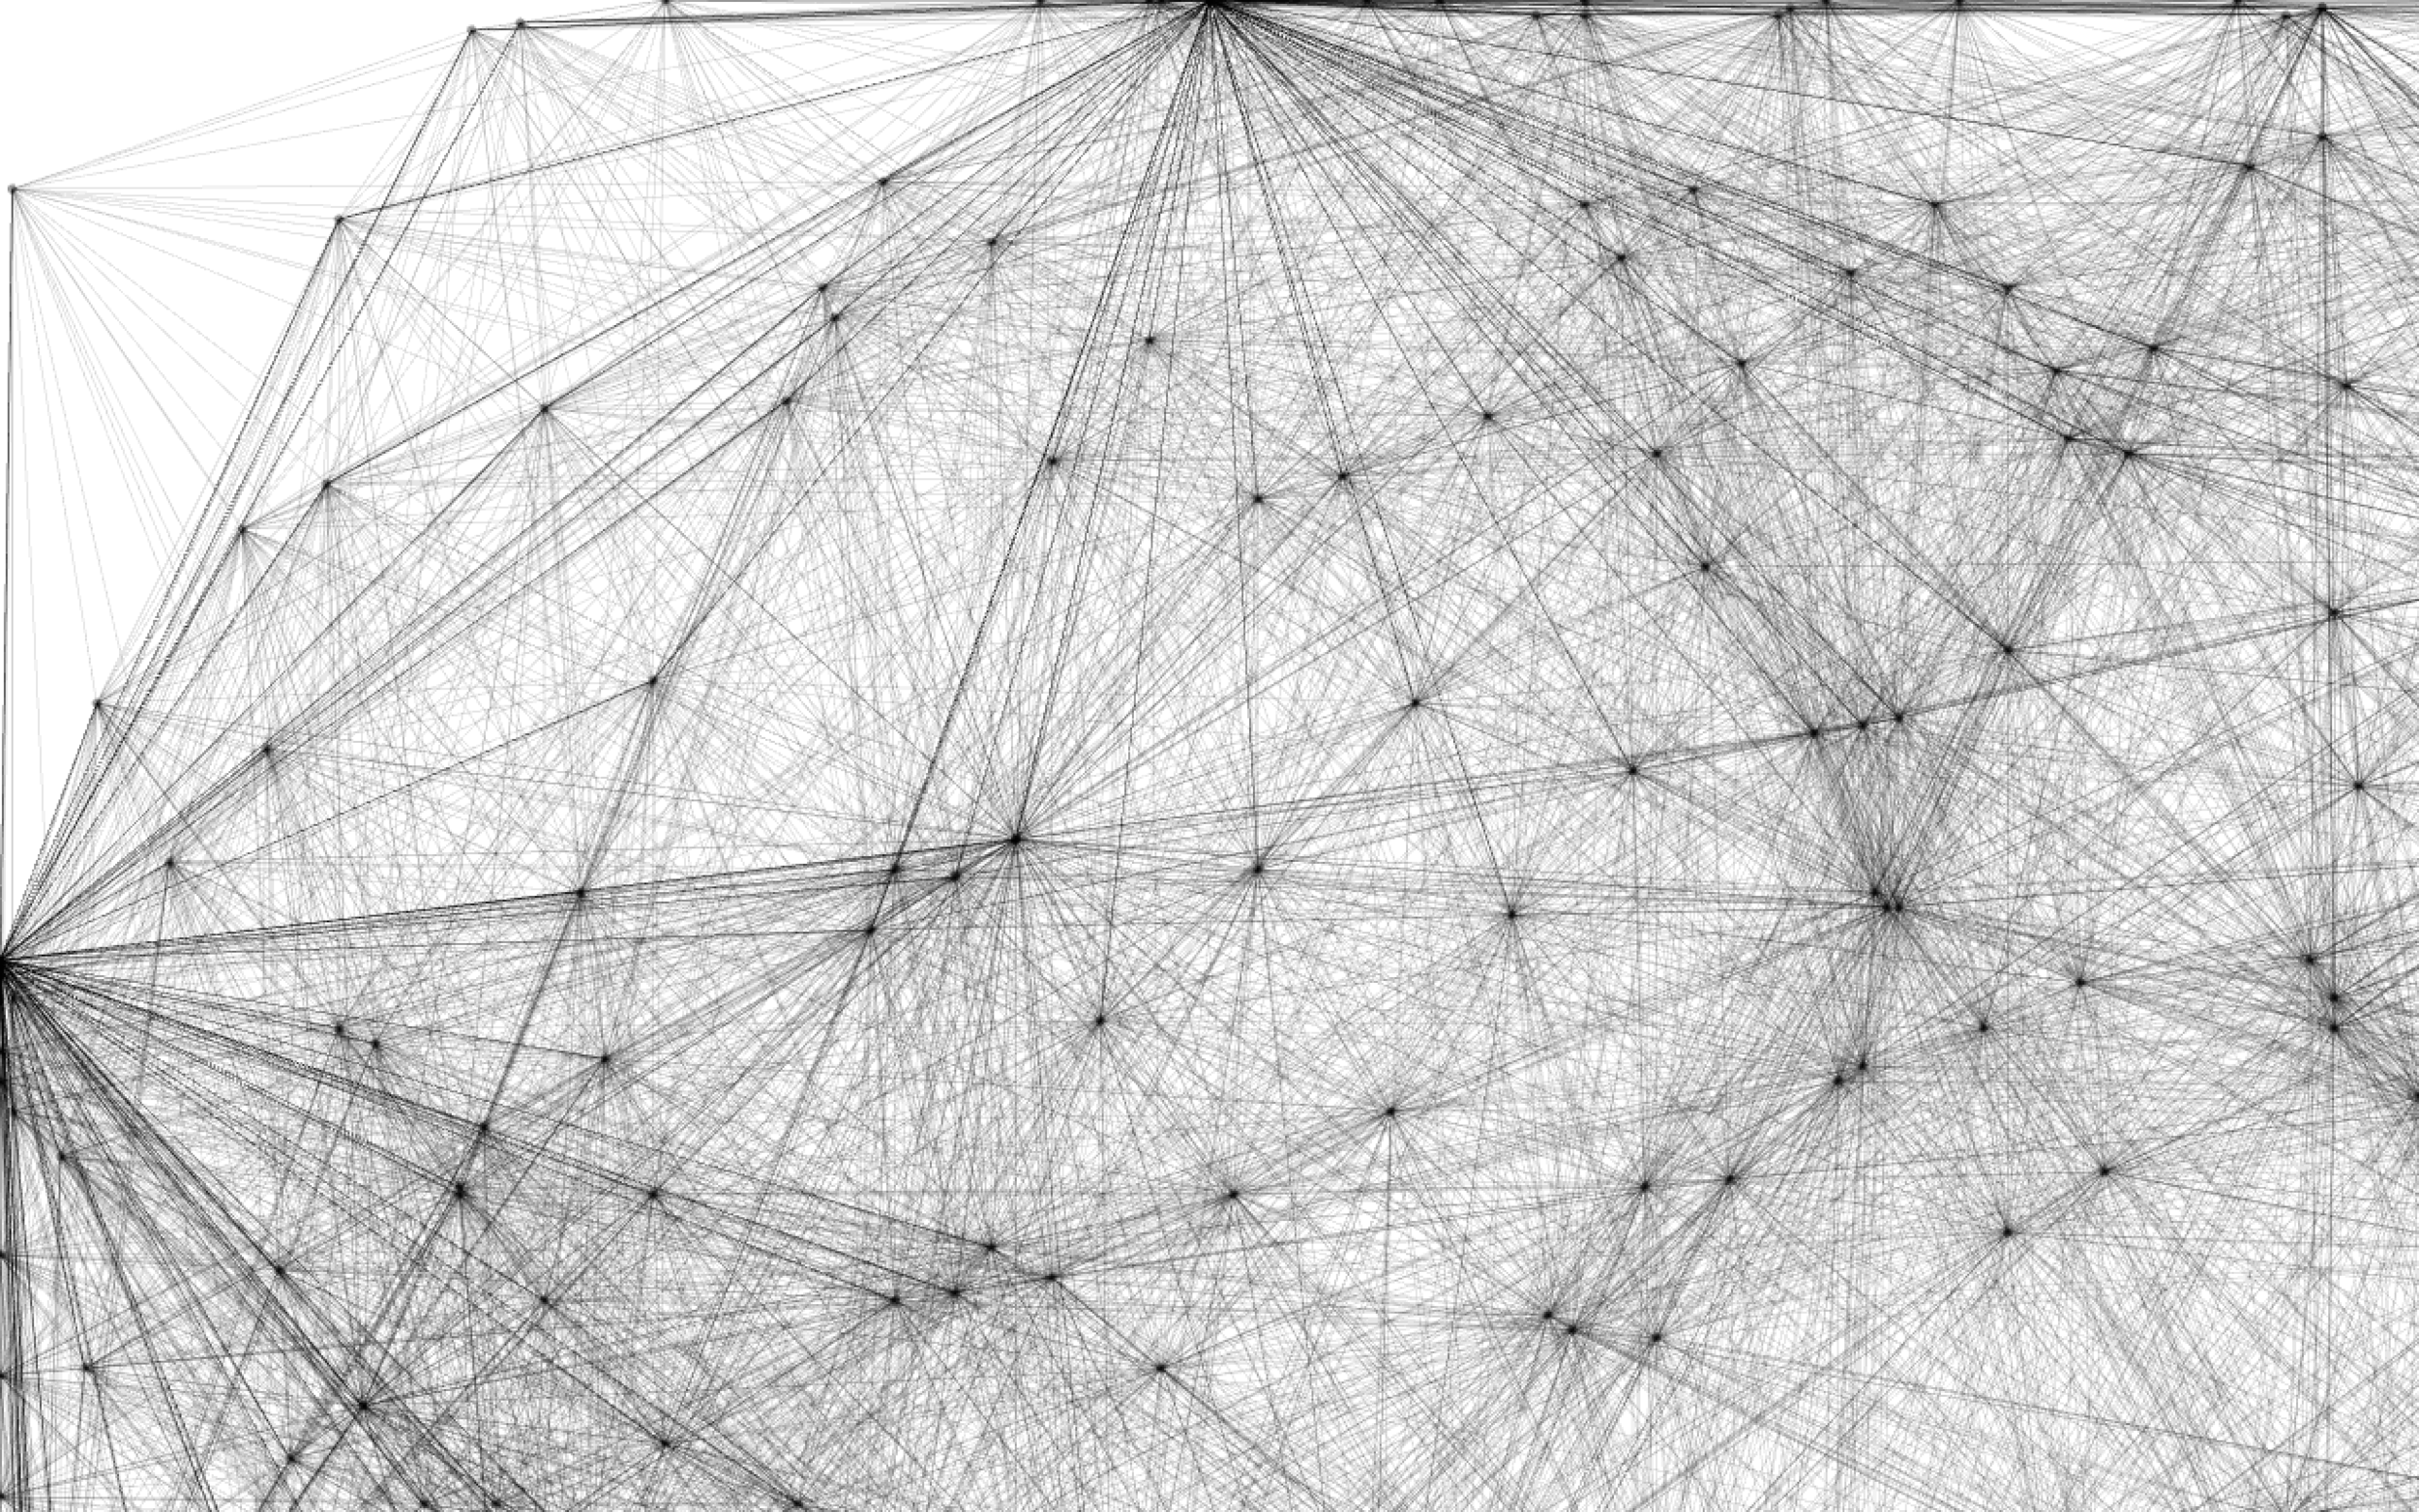
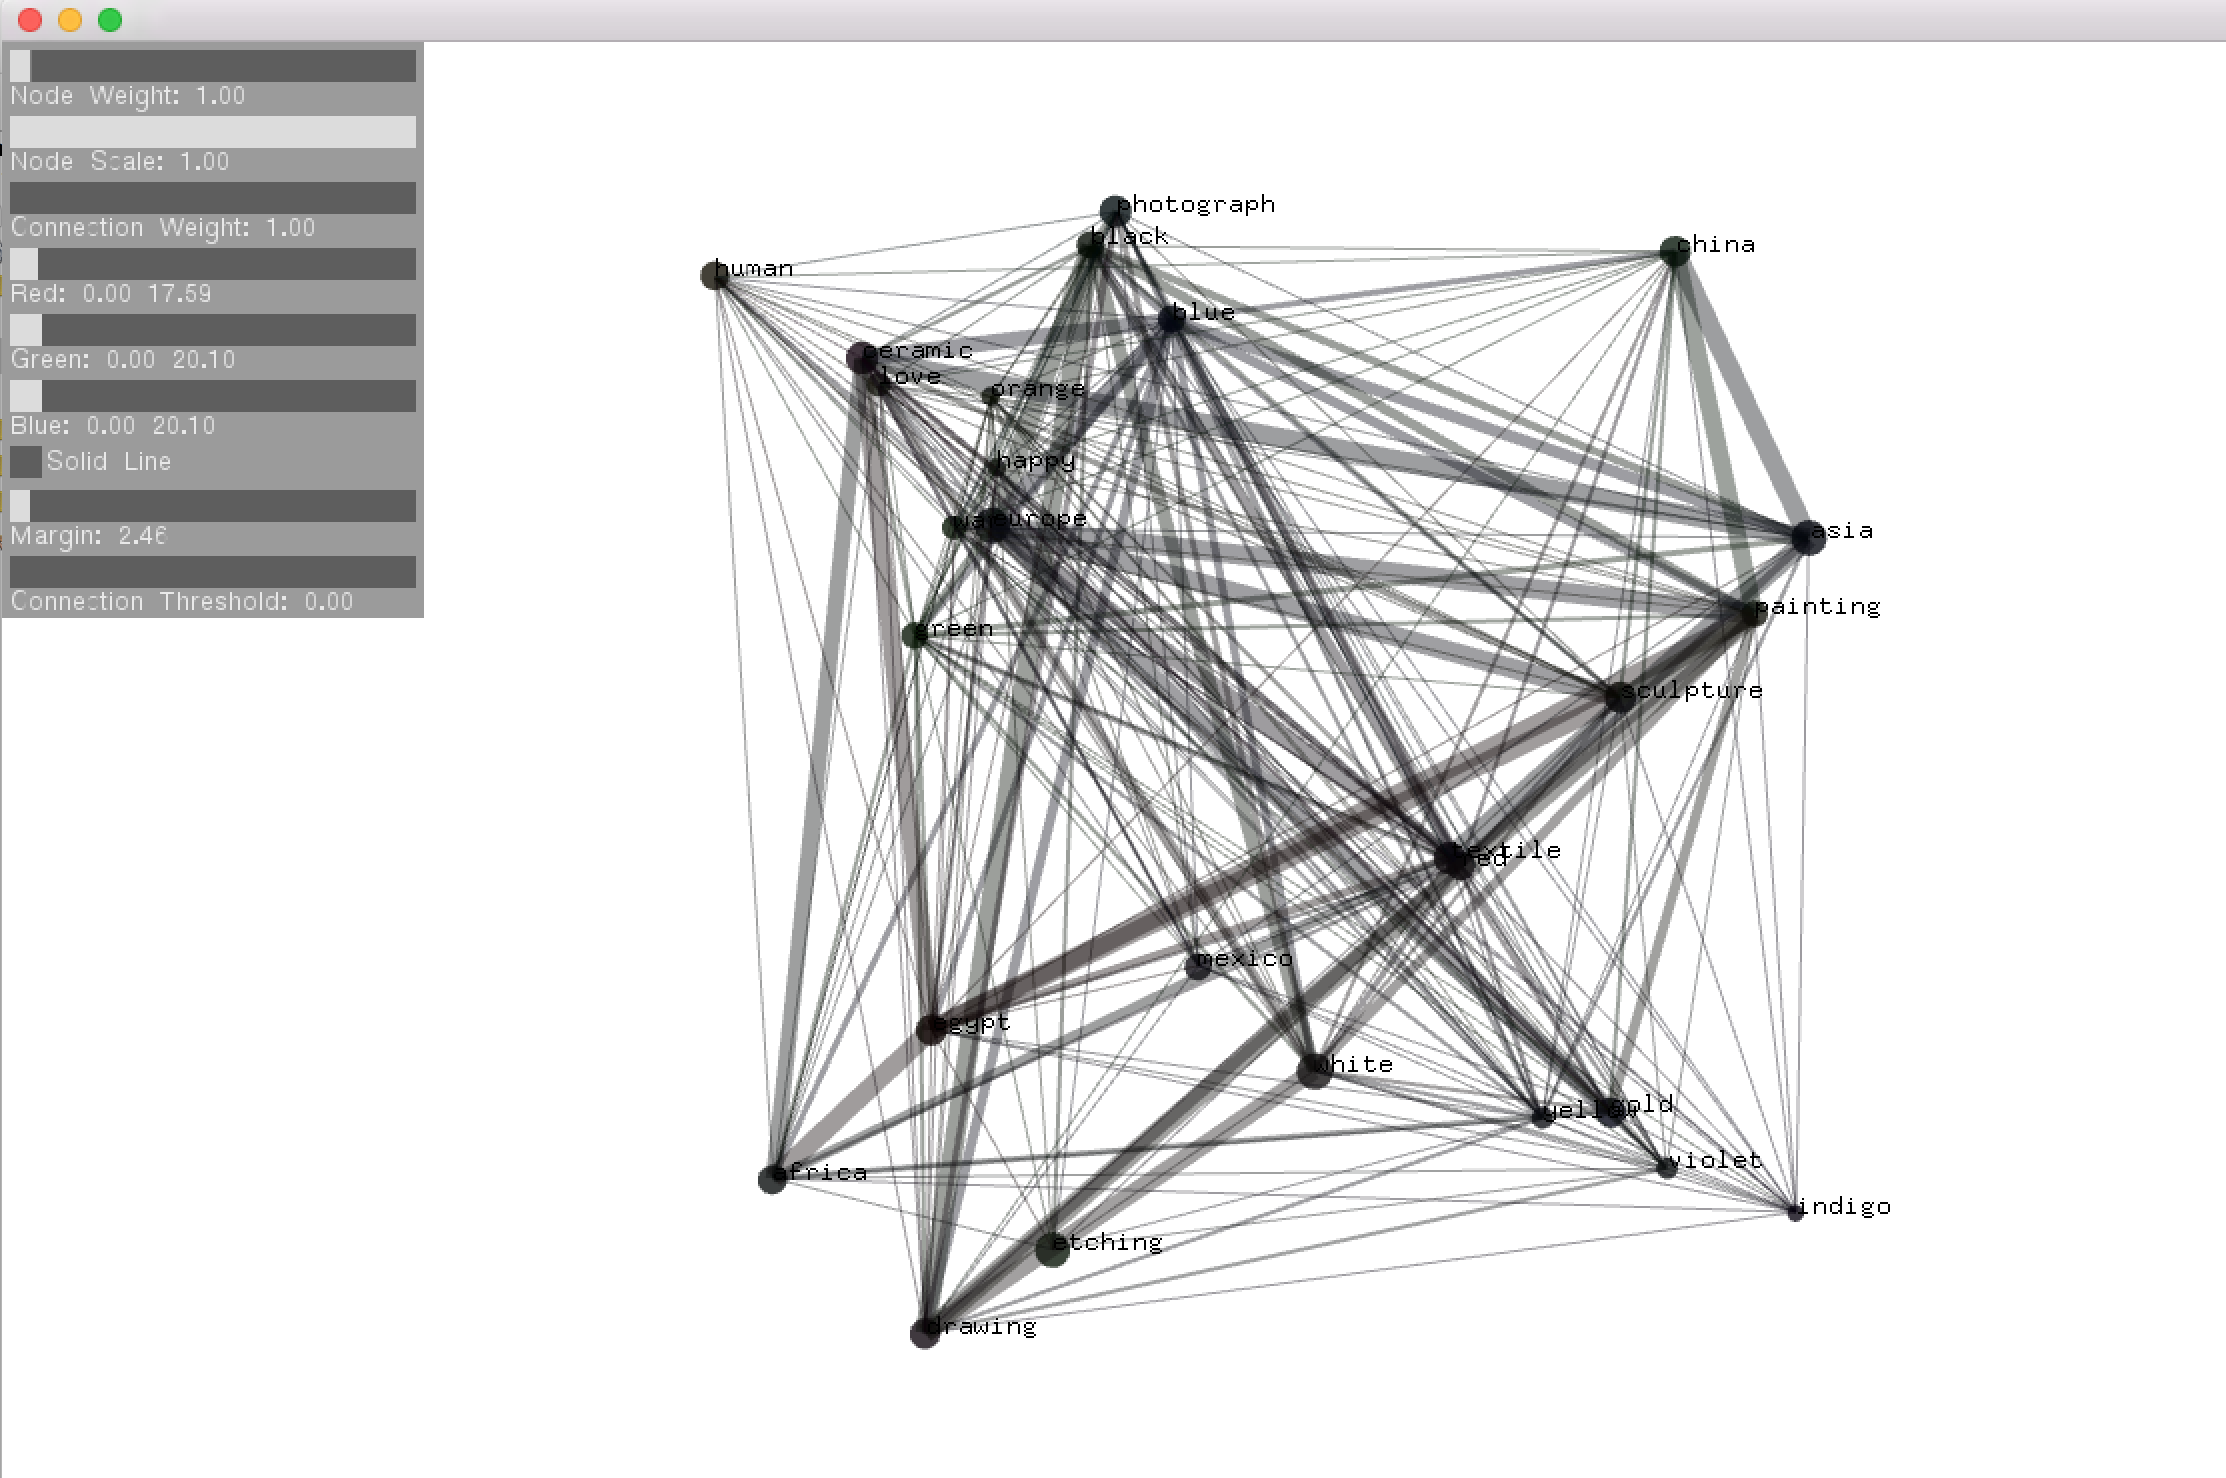
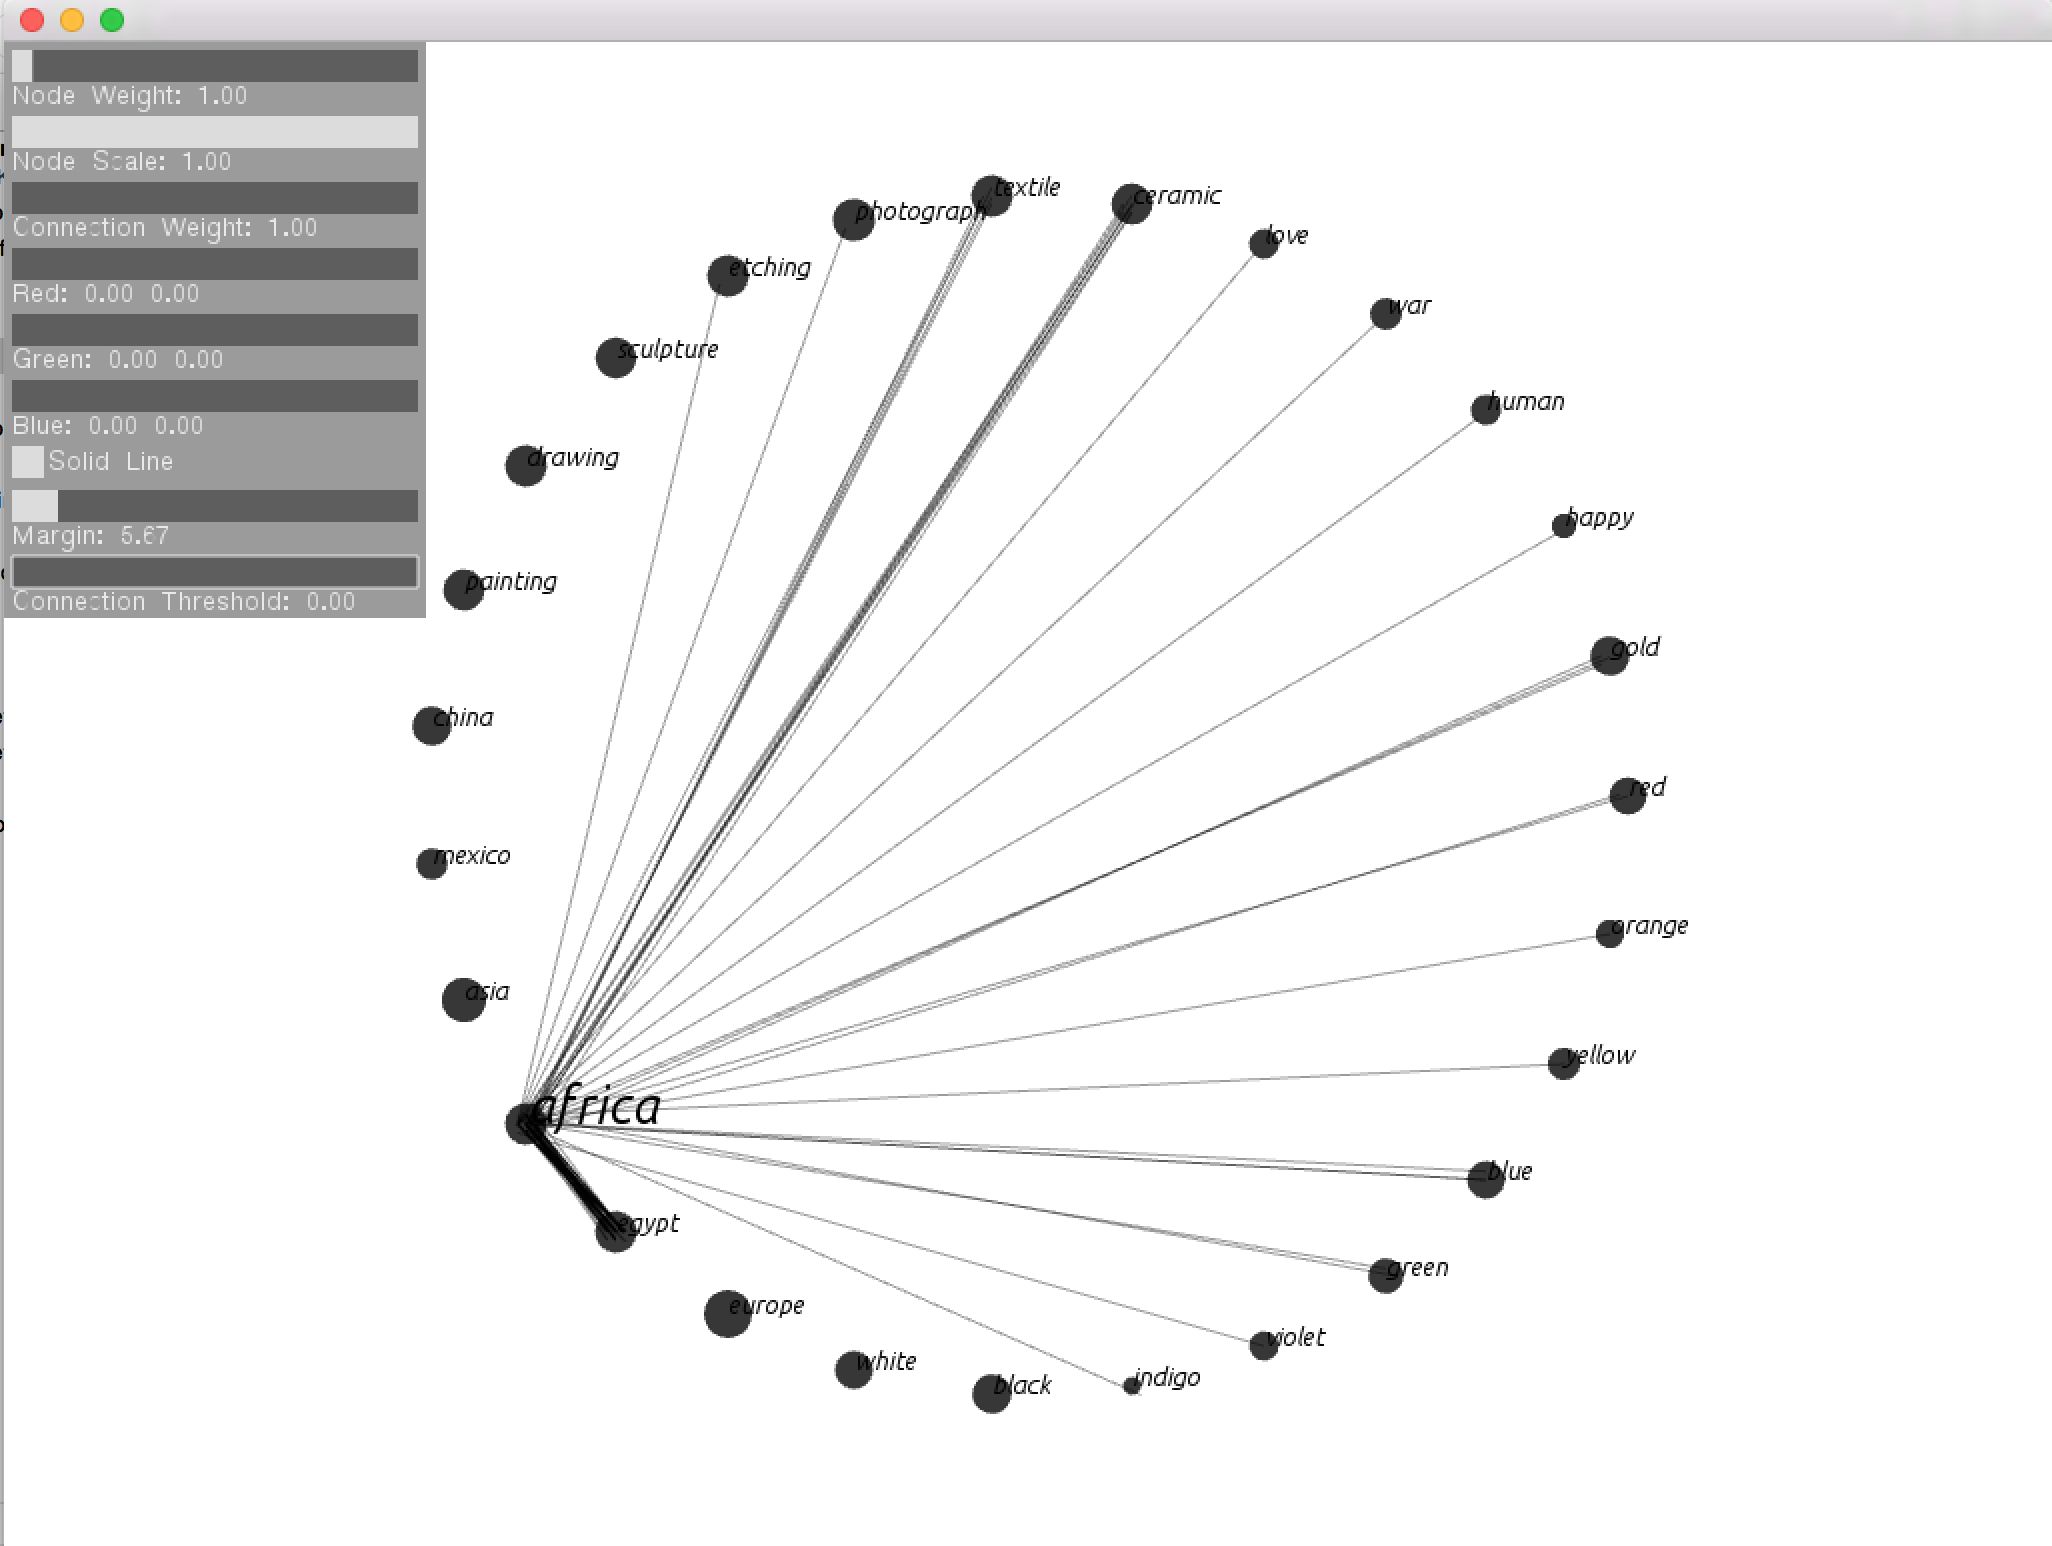
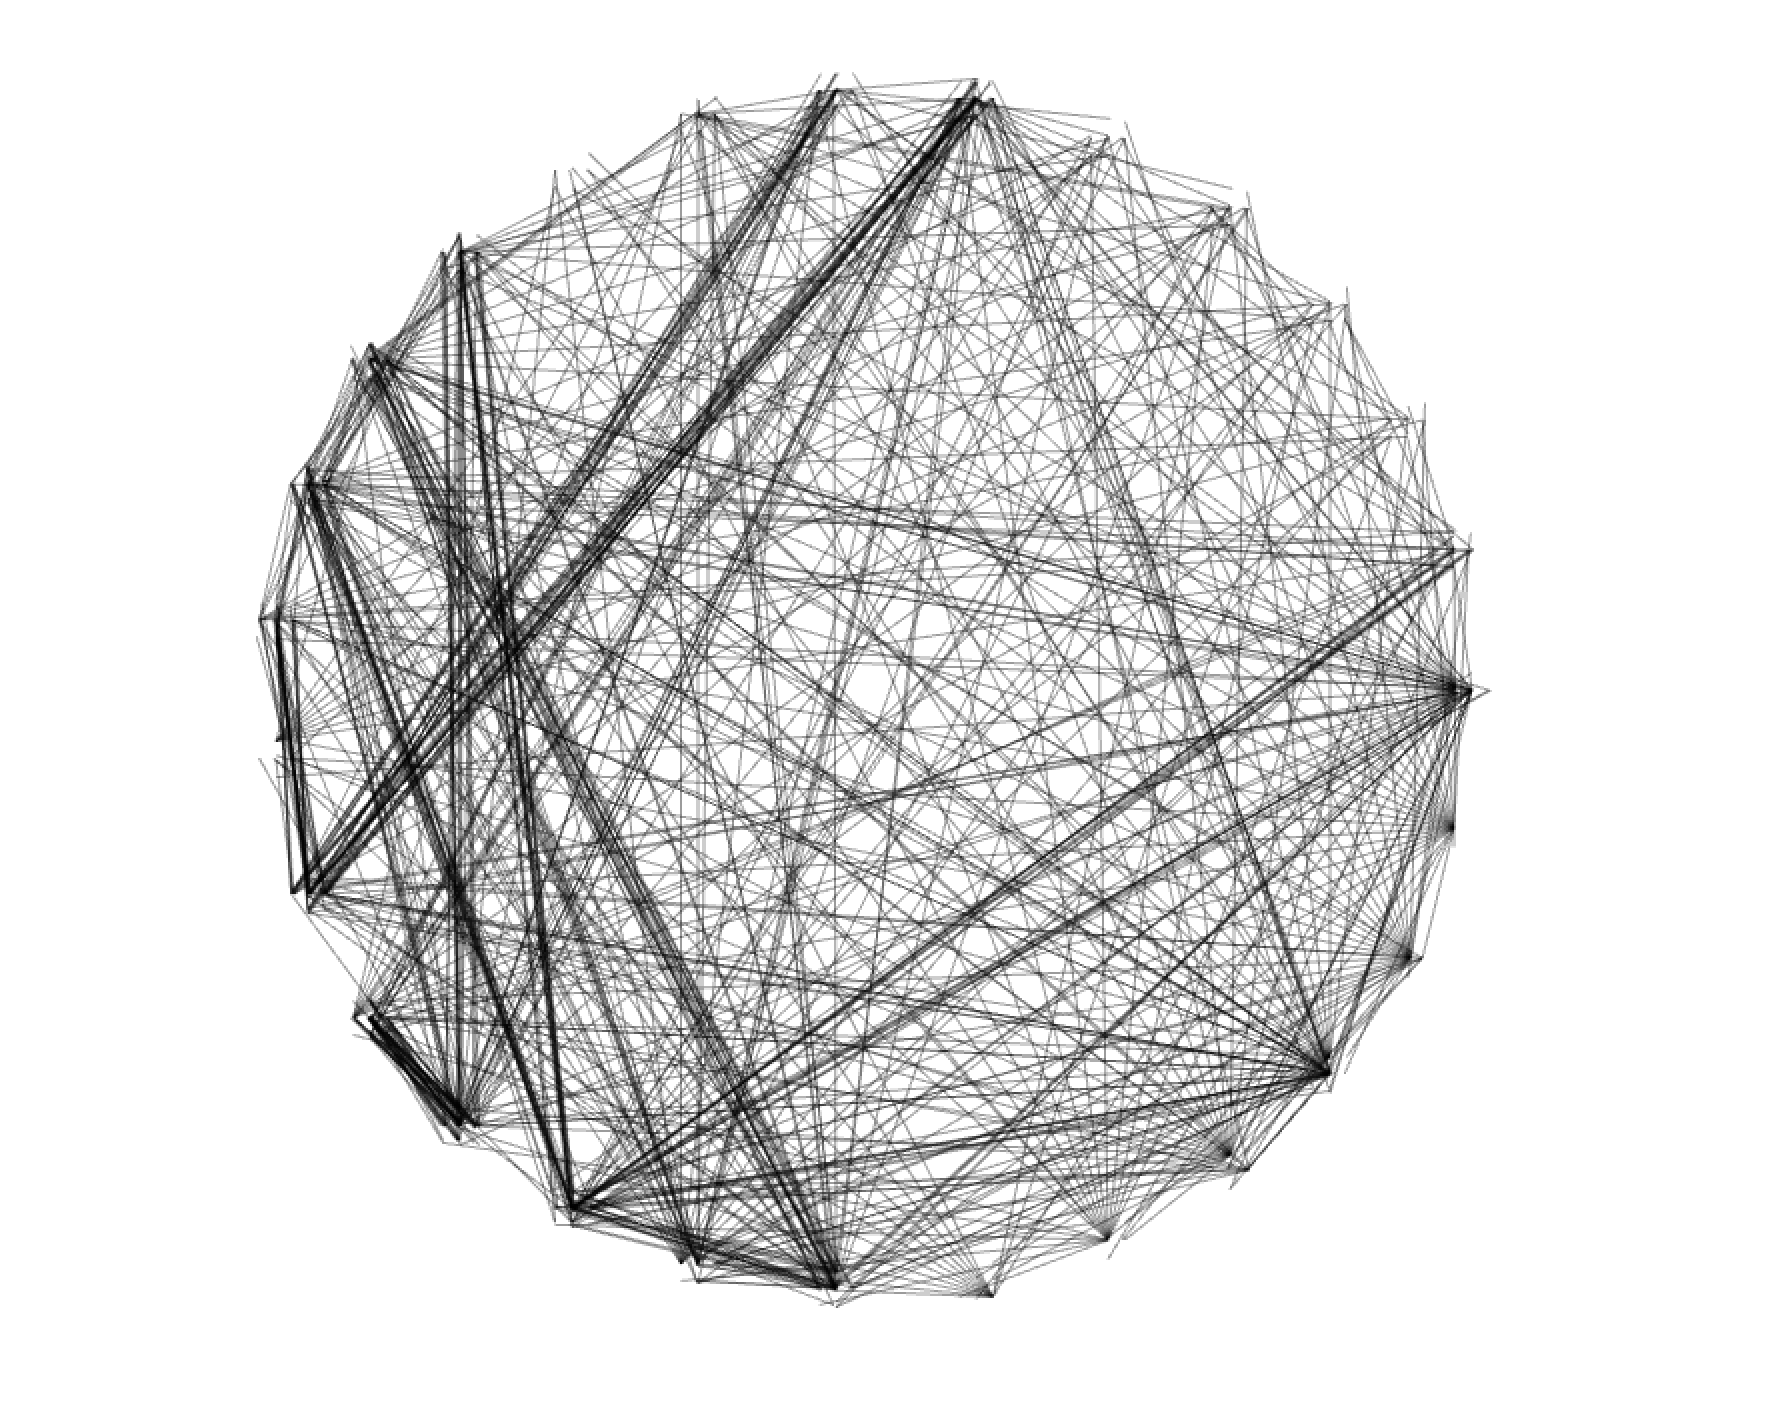
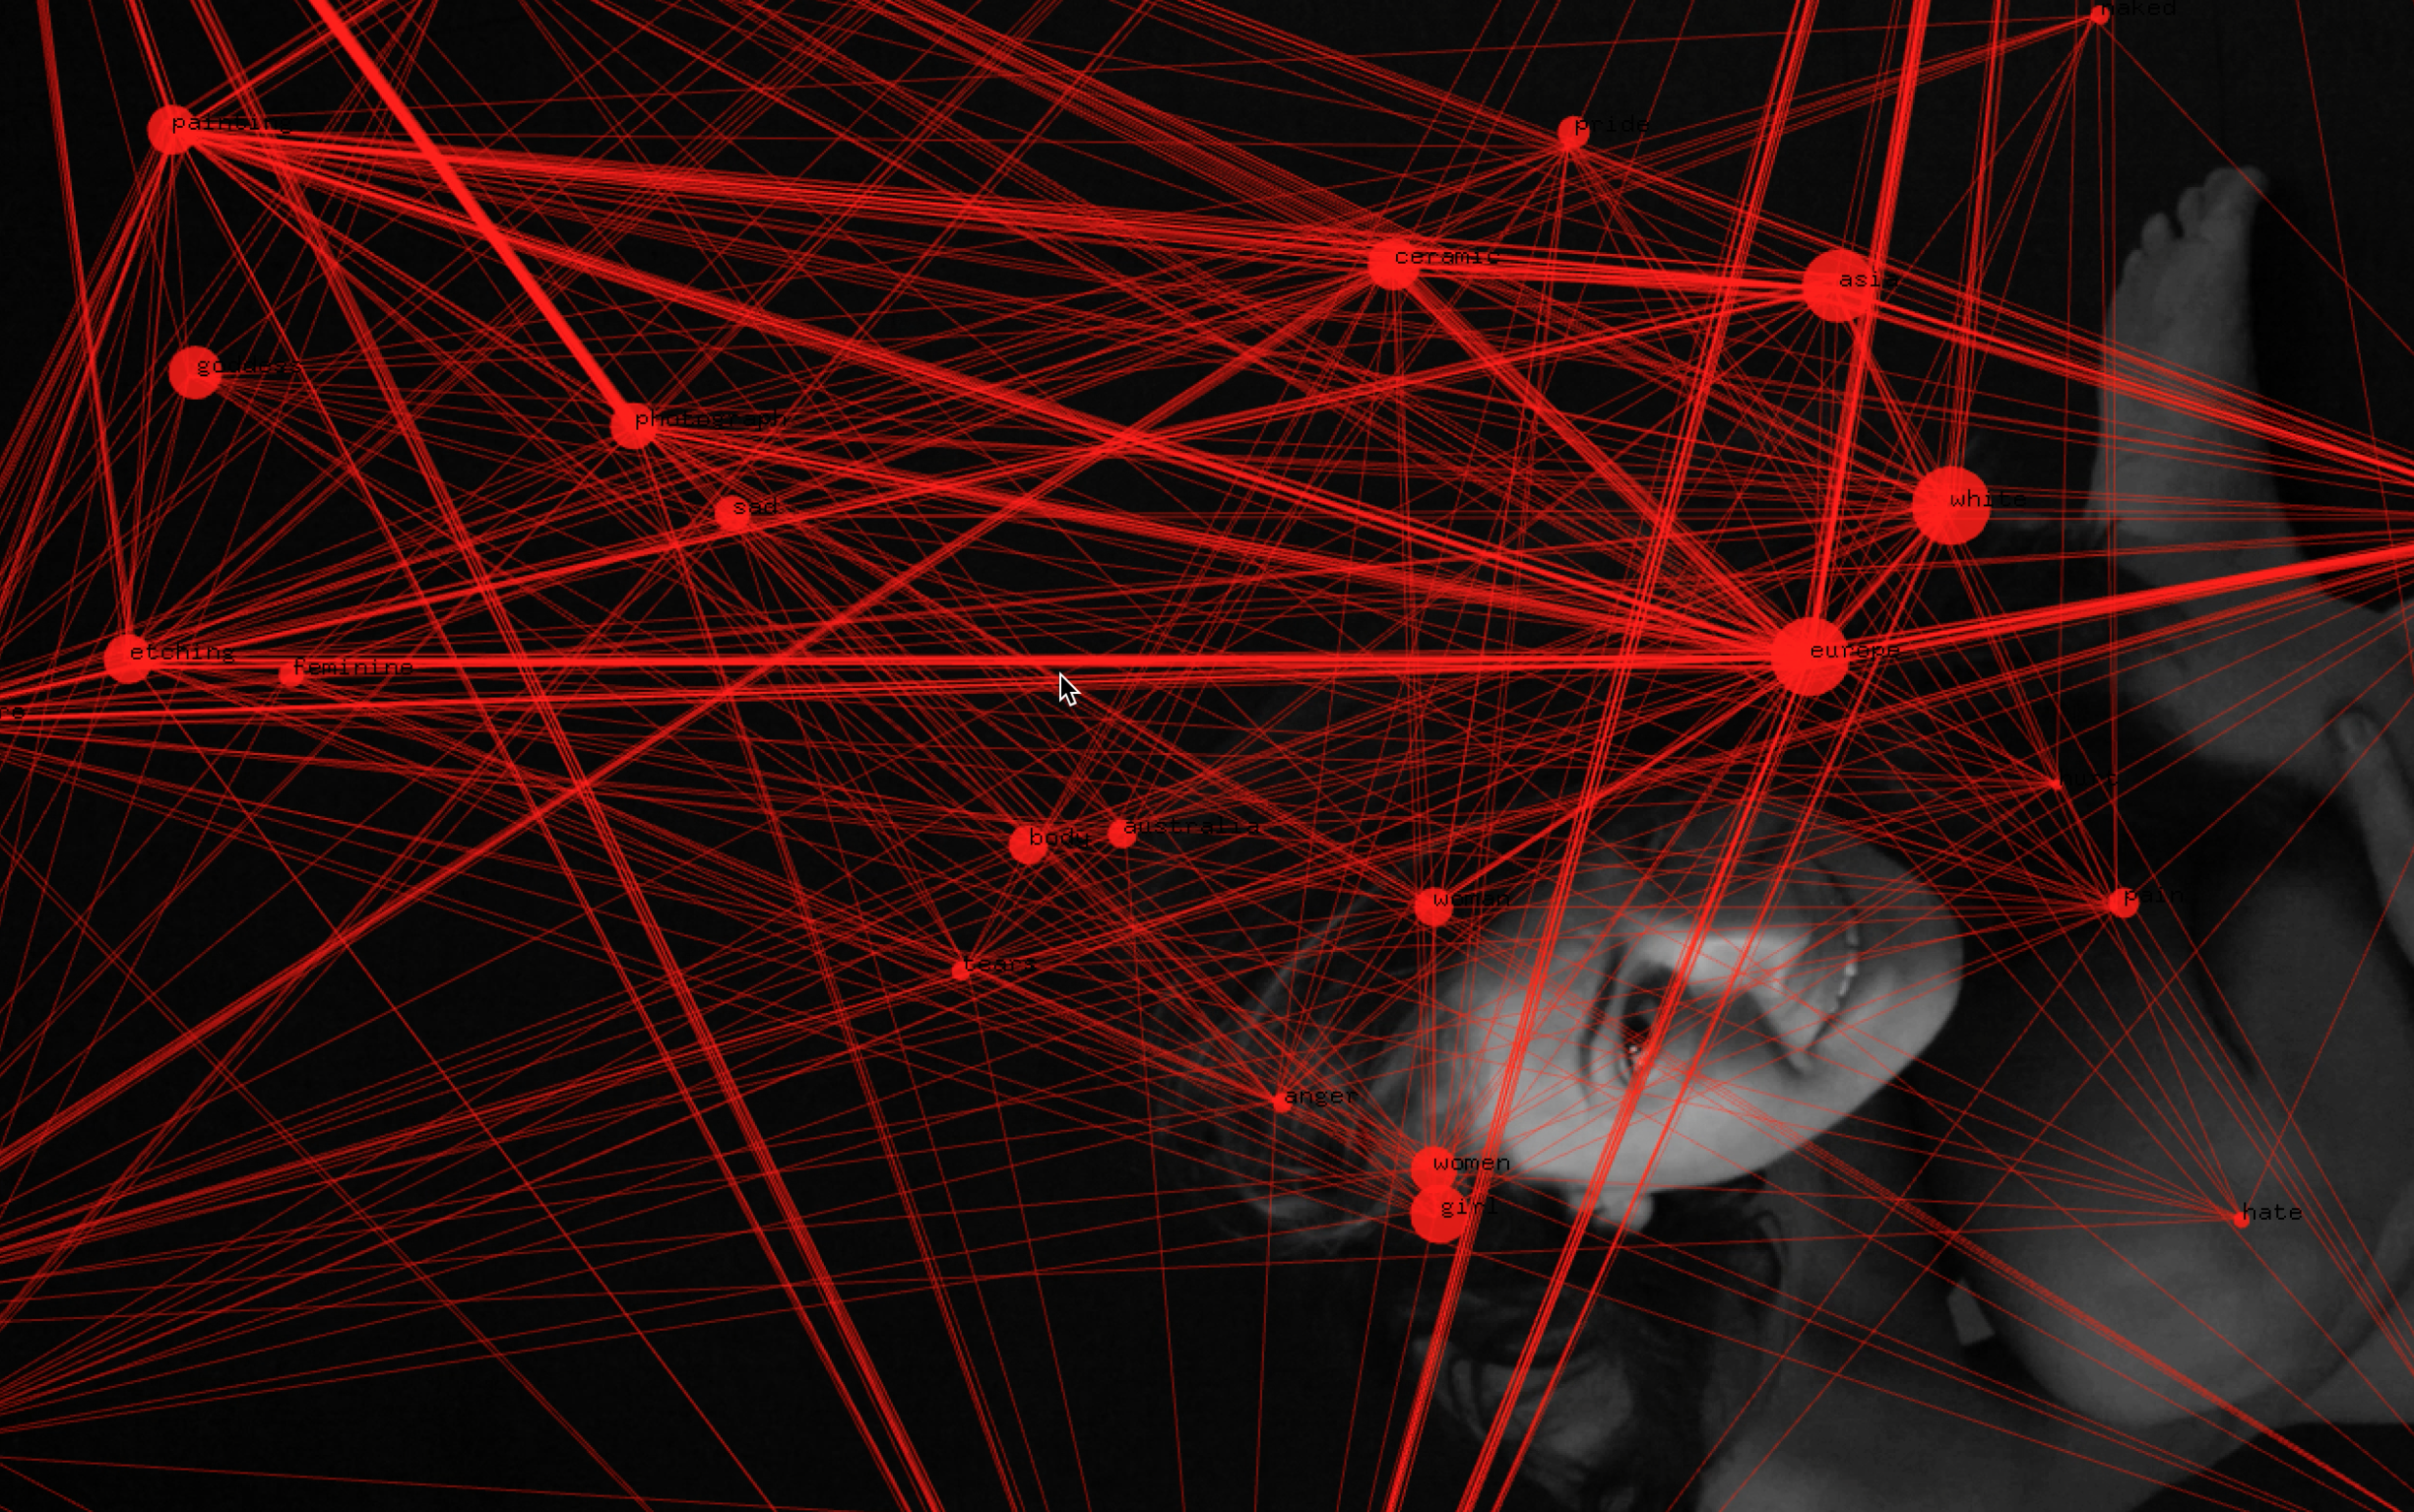
Three data visualization pieces ultimately emerged from this research project. The first piece, entitled Translating Topologies, was created using the star topology [n*(n-1)/2] on a set of 27 search terms. Using this set, and the corresponding metadata of the set, the topology was mapped by (1) sizing the nodes by the number of search results for each term and (2) weighting the connecting lines by the number of results corresponding to a search of any two nodes. The second piece, entitled An Ode to Sol, was created using the SOM algorithm by using one search term, i.e. “woman,” and isolating the RGB channels for every image associated with the result. The resulting SOM was then mapped into 2D space such that each point in the space corresponds to an image. Then each point was connected by a distance function.
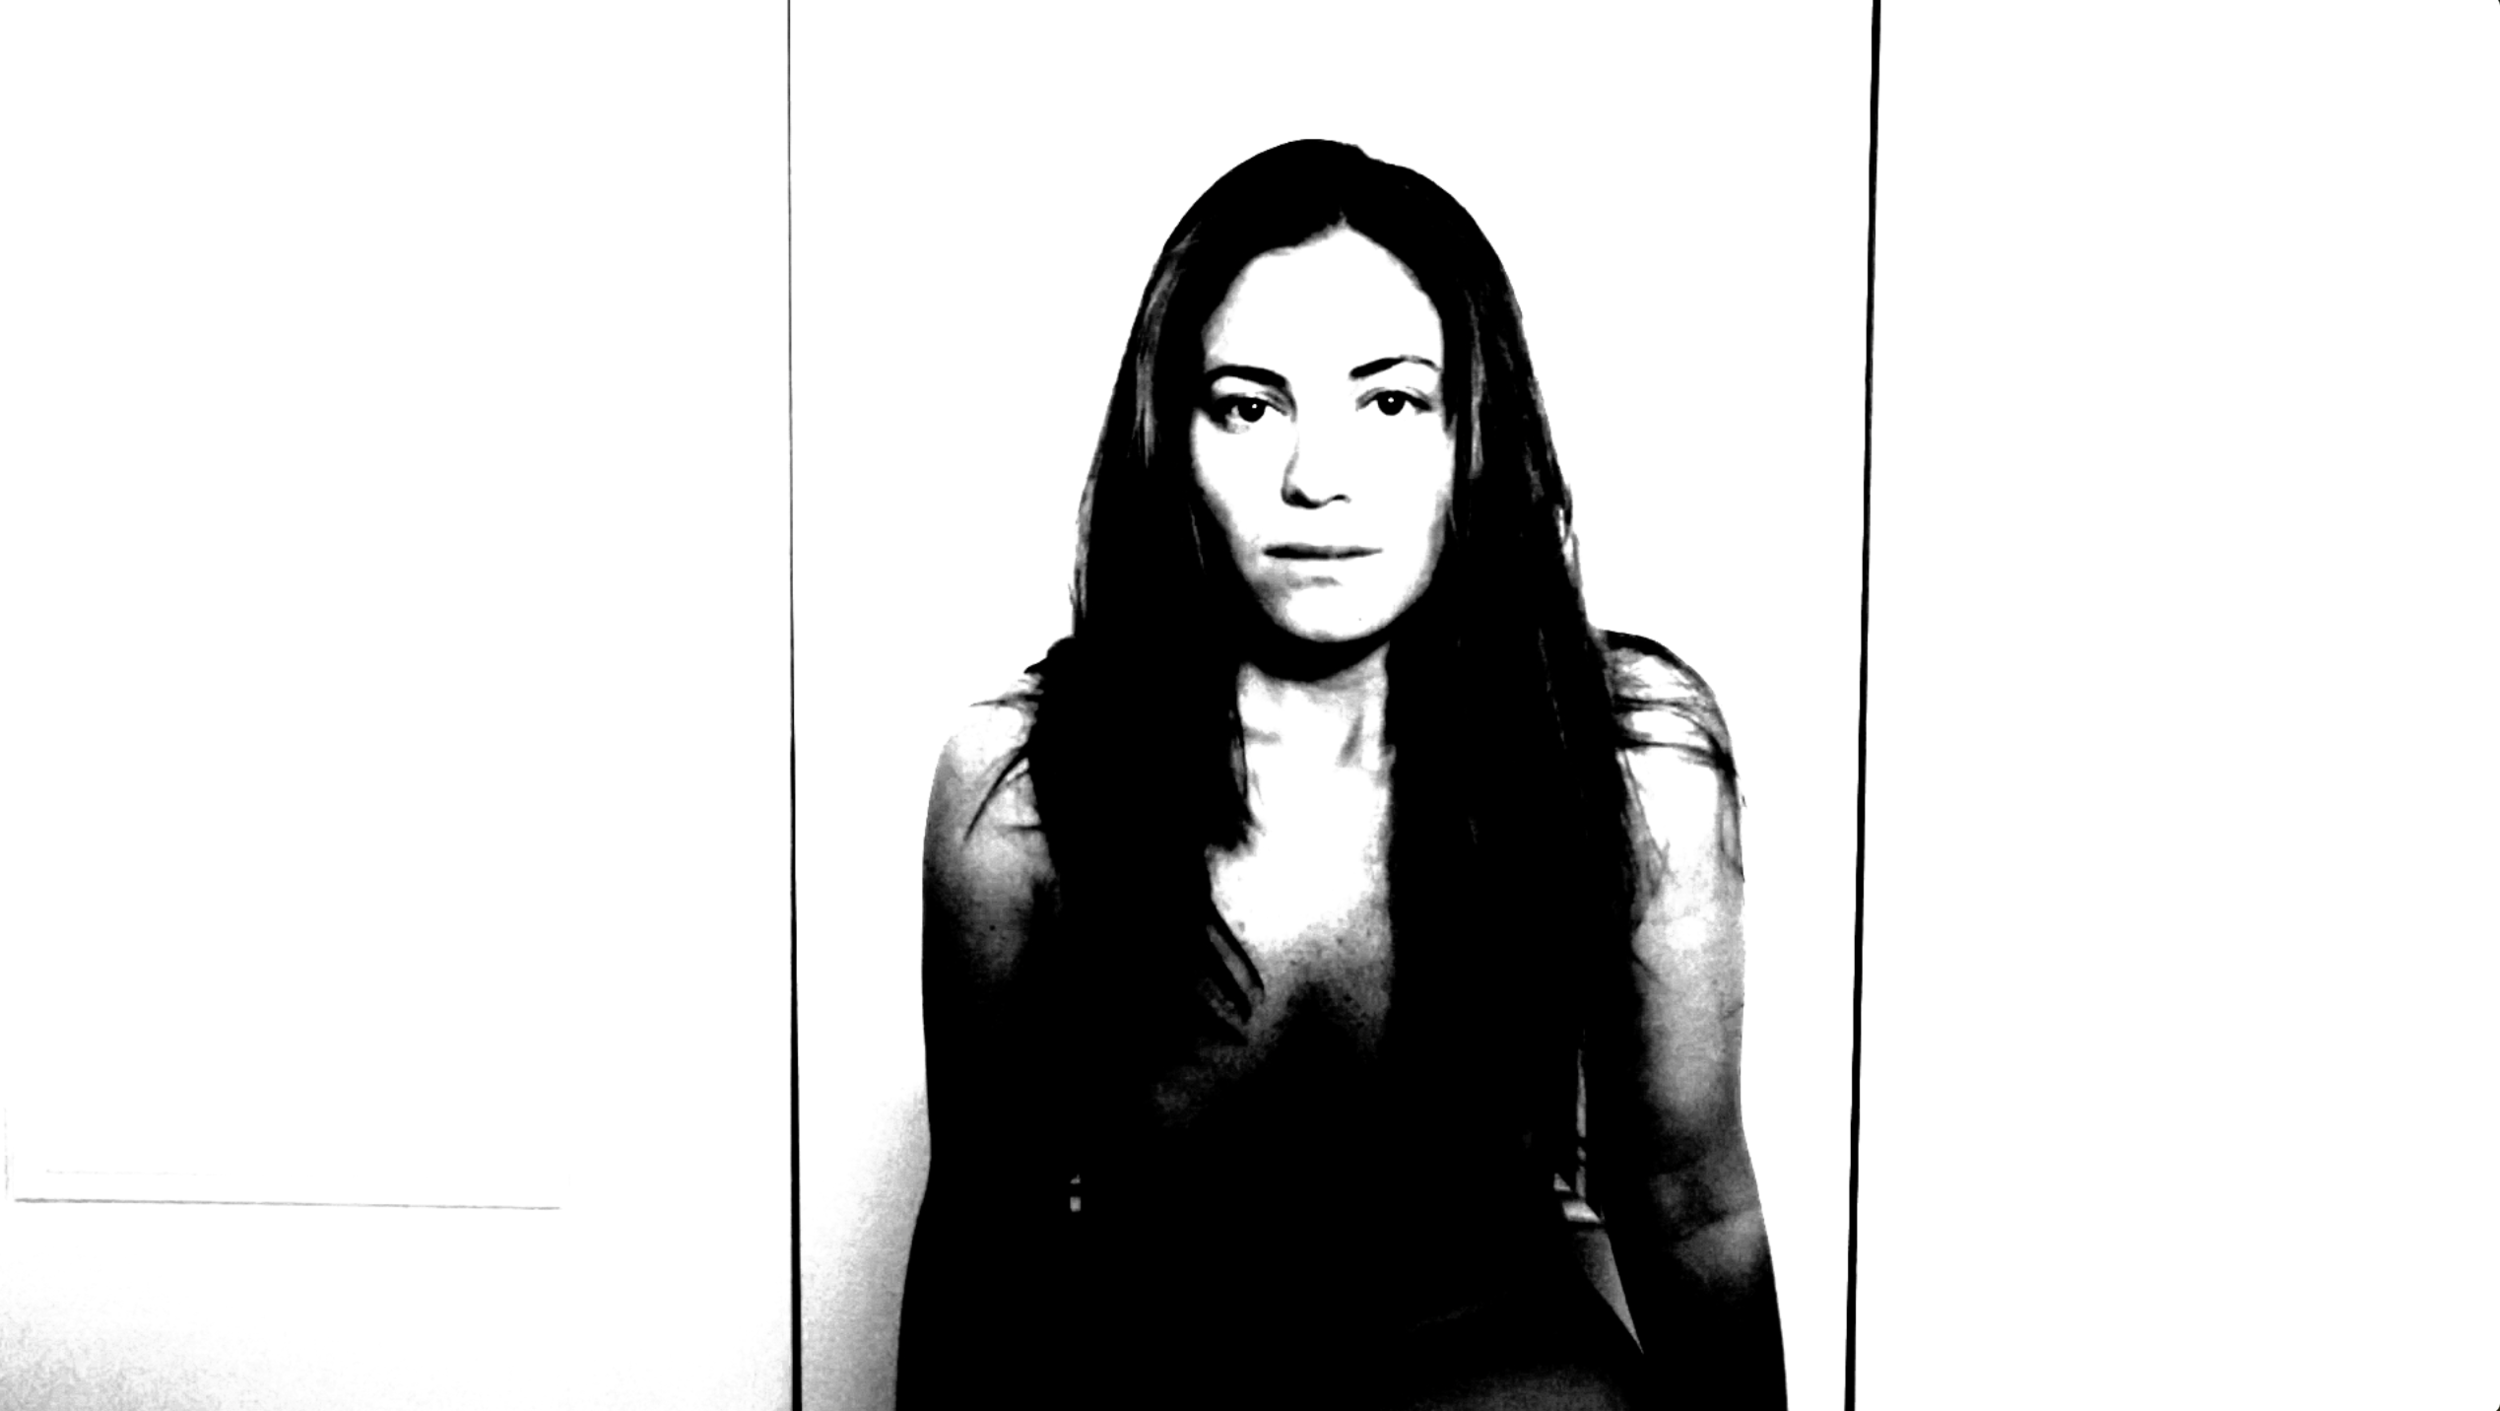
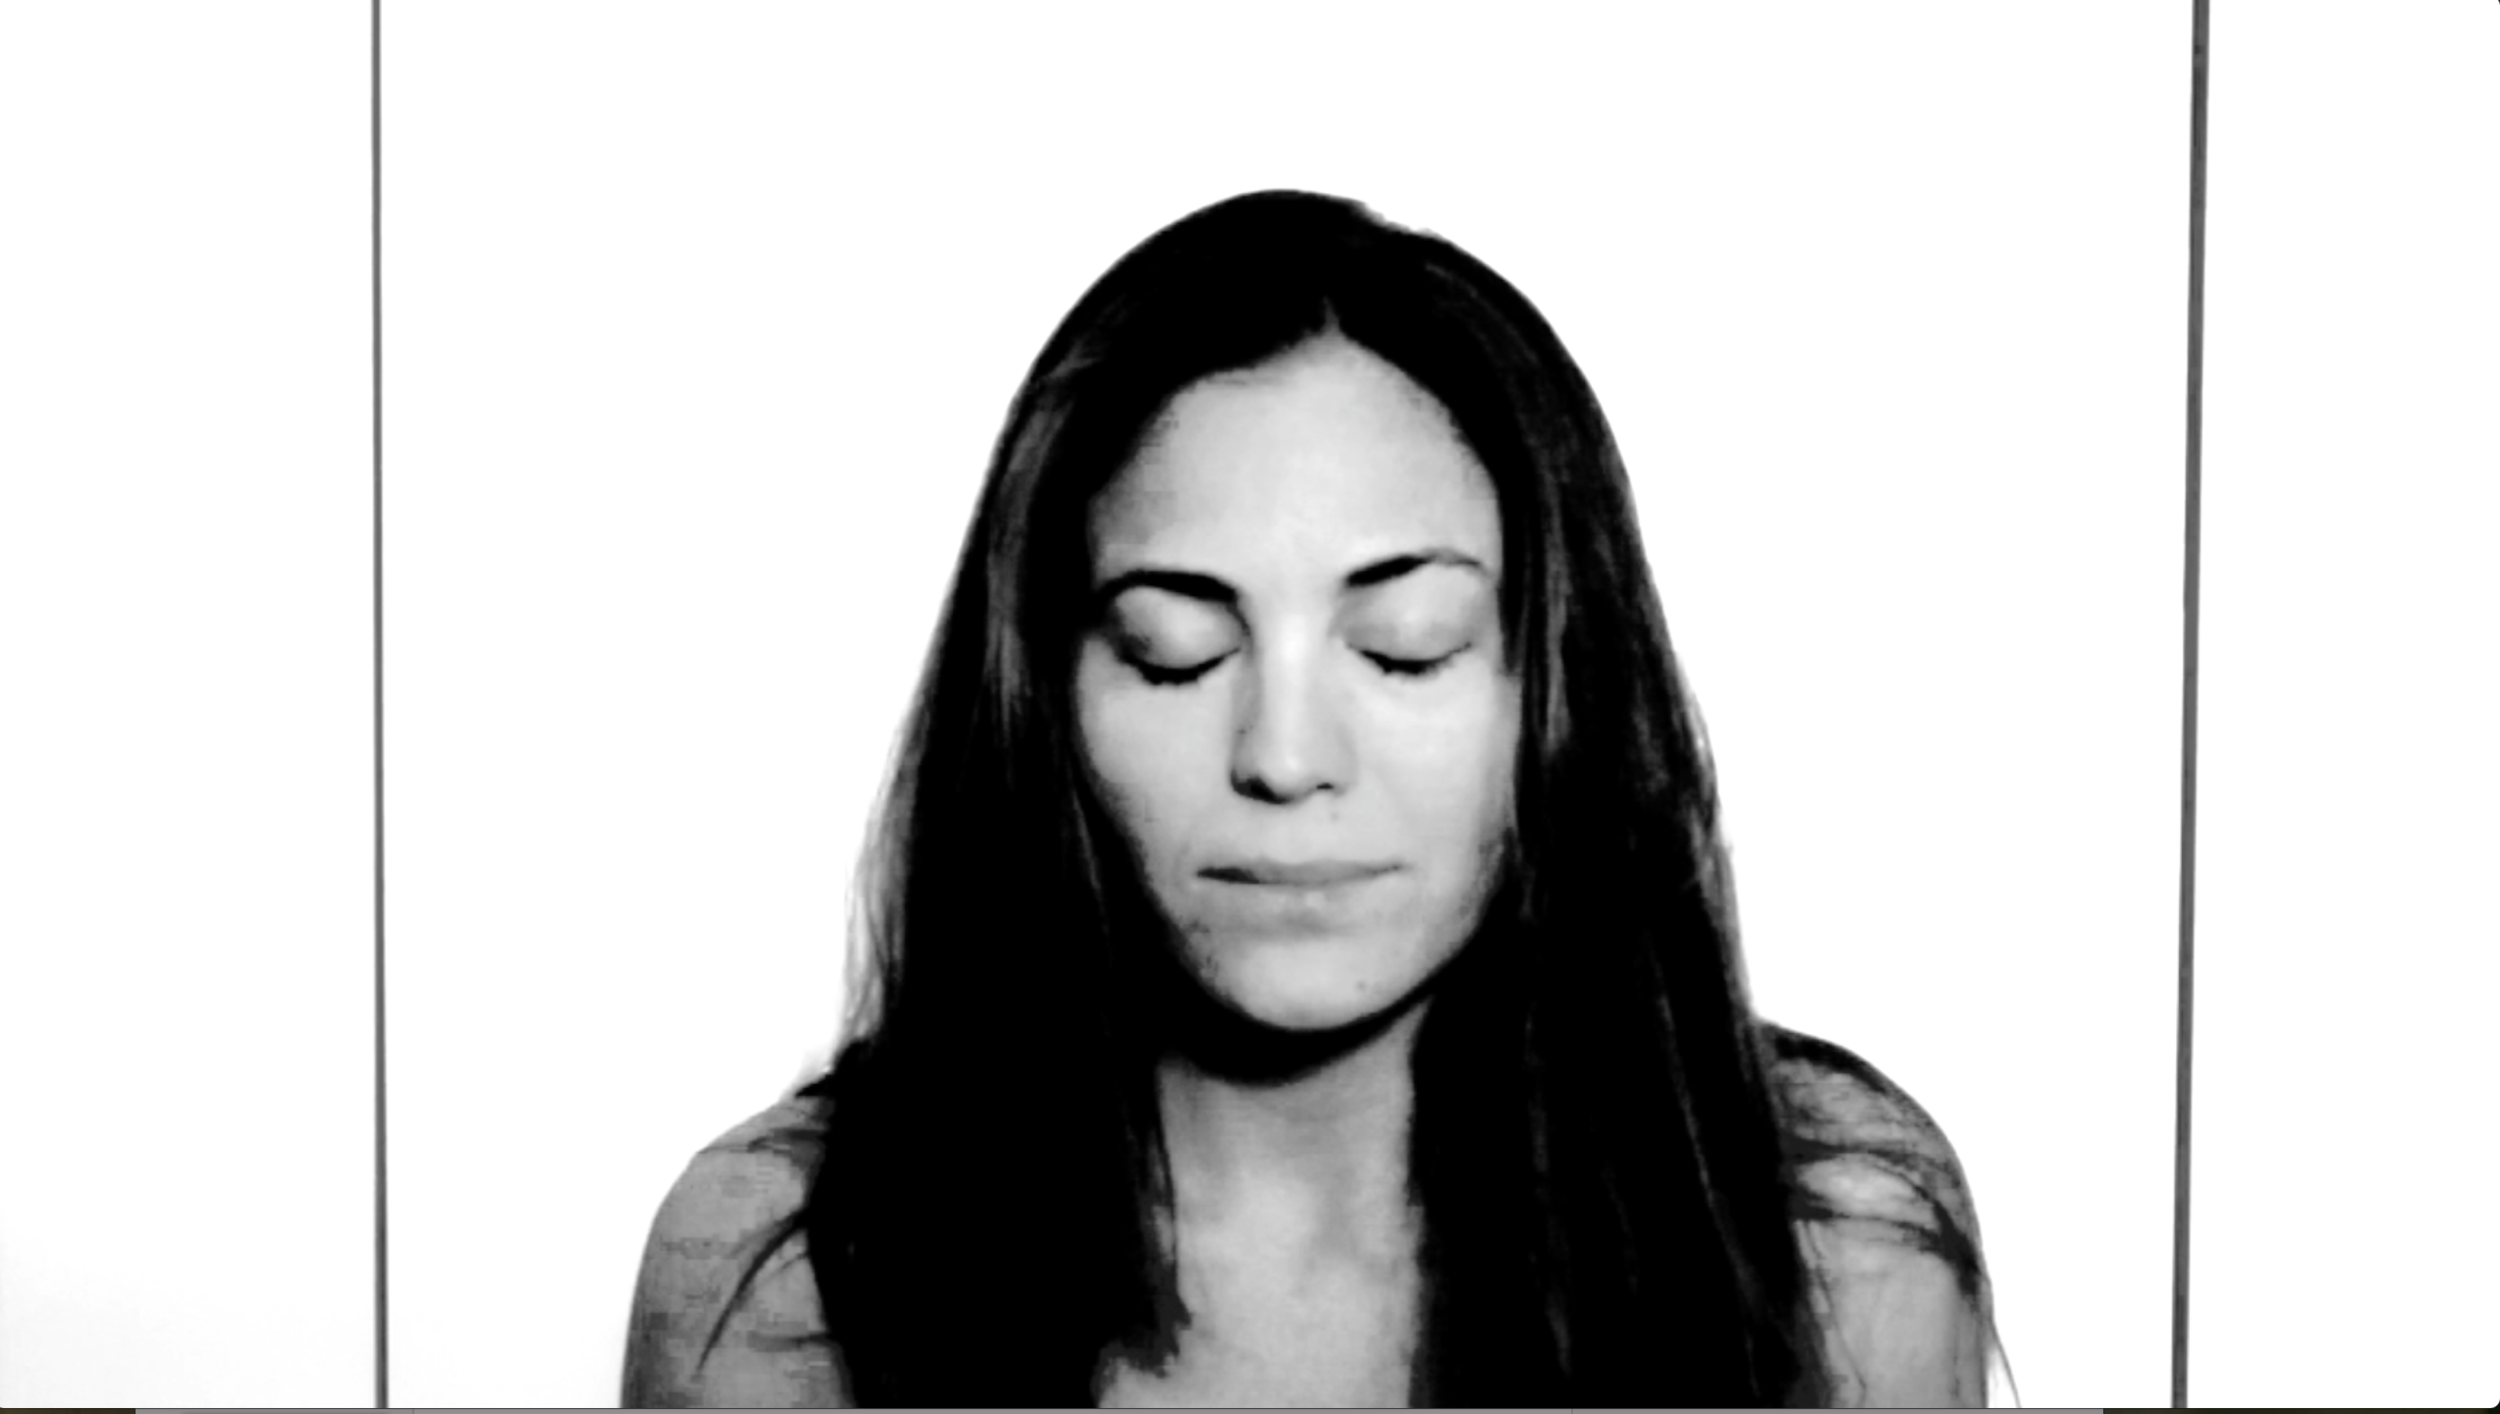
The final data visualization piece, the capstone of the <META>Methods research project, is entitled Data I Am. It is an interactive, mixed-media piece combining performance, video installation, and algorithmic art. It uses the data and algorithms from the prior two pieces but, by combining data with performance, adds a level of artistic interpretation. The data visualization accompanying the piece was created using a unique set of search words that deal with concepts related to the female form. This piece was inspired by what I learned from my investigations into the metadata of the Met’s database. Searching with the word “nude,” for example, reveals hundreds of works of art, through time and across cultures, of the voluptuous female form. I was inspired to use this idea to try to reimagine data visualization by using my own body and voice as an overlay to the data that defines me.
Data I Am is an audio-visual narrative. By combining data, algorithmic art, video manipulation, performance, and the interaction design toolkit within OF, I created an interpretation of a representation of data visualization. One key question I address is: How can we reduce Big Data “back to a human scale"? We can do this by creating “alternative metaphors” and by telling our stories using “alternative narratives.” We are all a dataset that is connected through a web of metadata, but what makes us unique are the stories of our lives and our own journeys through the subsets and supersets of information. Algorithms and mathematics are beautiful and can help us learn about our world, but ultimately it is our tragic and vulnerable humanness that can breathe life into the data that defines us.