Progress report:
I am pursing two parallel streams of work:
- Creating data visualizations of my two data sets to form a body of work that can be bound with the final writing piece.
- Investigating the story that this data is telling (i.e what it is that I can learn from this data) to form a narrative that can be expressed through an artistically compelling web-based experience/installation. This in large, at this point in the process, is with regards to understanding the science behind the data — marrying the science, to the data, to the narrative.
I had a meeting with one of a scientist from the Cornell lab. She explained to me that, while there is preliminary evidence of health links such as obesity and depression to the microbiome, there is really not enough evidence to responsibly make that link. I think this is probably an area that I can discuss in the paper that will point to the importance and relevance of the microbiome as a topic. There are plenty of white papers that discuss the health links that can support my arguments. However, in terms of my core thesis questions, I think this is not the area that I will pursue.
Also, I think for me personally I am not interested in pursuing the environmental angle (i.e. links to chemicals, toxins). After thinking about this more, the original impetus is Powers of Ten. I want to inspire people, not scare them. I want this work to be more focused on the positive aspects of the hidden microbial world.
So in terms of the questions that frame the making, I am exploring more spacial perception and the ways that humans perceive the world. Here are some inspiration projects I am thinking about:
I am exploring the way that humans can visualize this invisible world.
I am asking:
- If humans could perceive the microbial world, what would that look like?
- How can we visualize the effects of the built environment on the microbial world?
- What does that distortion look like? Clouds? Shadows?
- How can we visualize the functional pathways of the microbial communities in NYC to tell a story about our relationship with microbes?
Further research into what the functional pathways are will shed light on what these microbes do. This will begin to open the narrative up to the relationship with humans. And, thus later I can start asking: how does the microbiome effect the human living there?
Technical Progress:
In total there are 2 data sets:
- Taxonomical (which I presented at the last presentation) which shows what bacteria are present in the hives
- Functional Analysis which shows what the different bacteria do.
Here is a link to my github with all the code parsing and tests I have been doing:
https://github.com/reginaflores/Biological_Immaterials
Taxonomical data:
1) I spent more time parsing data into more JSON formats to be able to experiment graphically representing the data. I now have a pretty robust data suite to work with and a number of algorithms to use.
2) I spent some time looking at the taxonomical data and made a flare map that shows the species diversity in each hive and the overlap of species between hives. See the attached images. This was really an experiment to start thinking about how I could represent this data.


Functional Analysis data:
1) I spent a lot of time looking at the functional analysis data and parsed it using a few methods:
- After speaking to the Bioinformatics expert on the team, I performed some statistical analysis on the data according to her suggestions.
- First I filtered for low abundance by removing the outliers (i.e. comparing across the rows the numbers that were outside the 20th percentile - left side of the standard normal distribution).
- Second I removed low variance occurrences i.e. removing items 2 standard deviations from the mean.
2) I was then left with another robust data suite for the functional analysis. Yet, I was having a hard time thinking about how to visualize this.
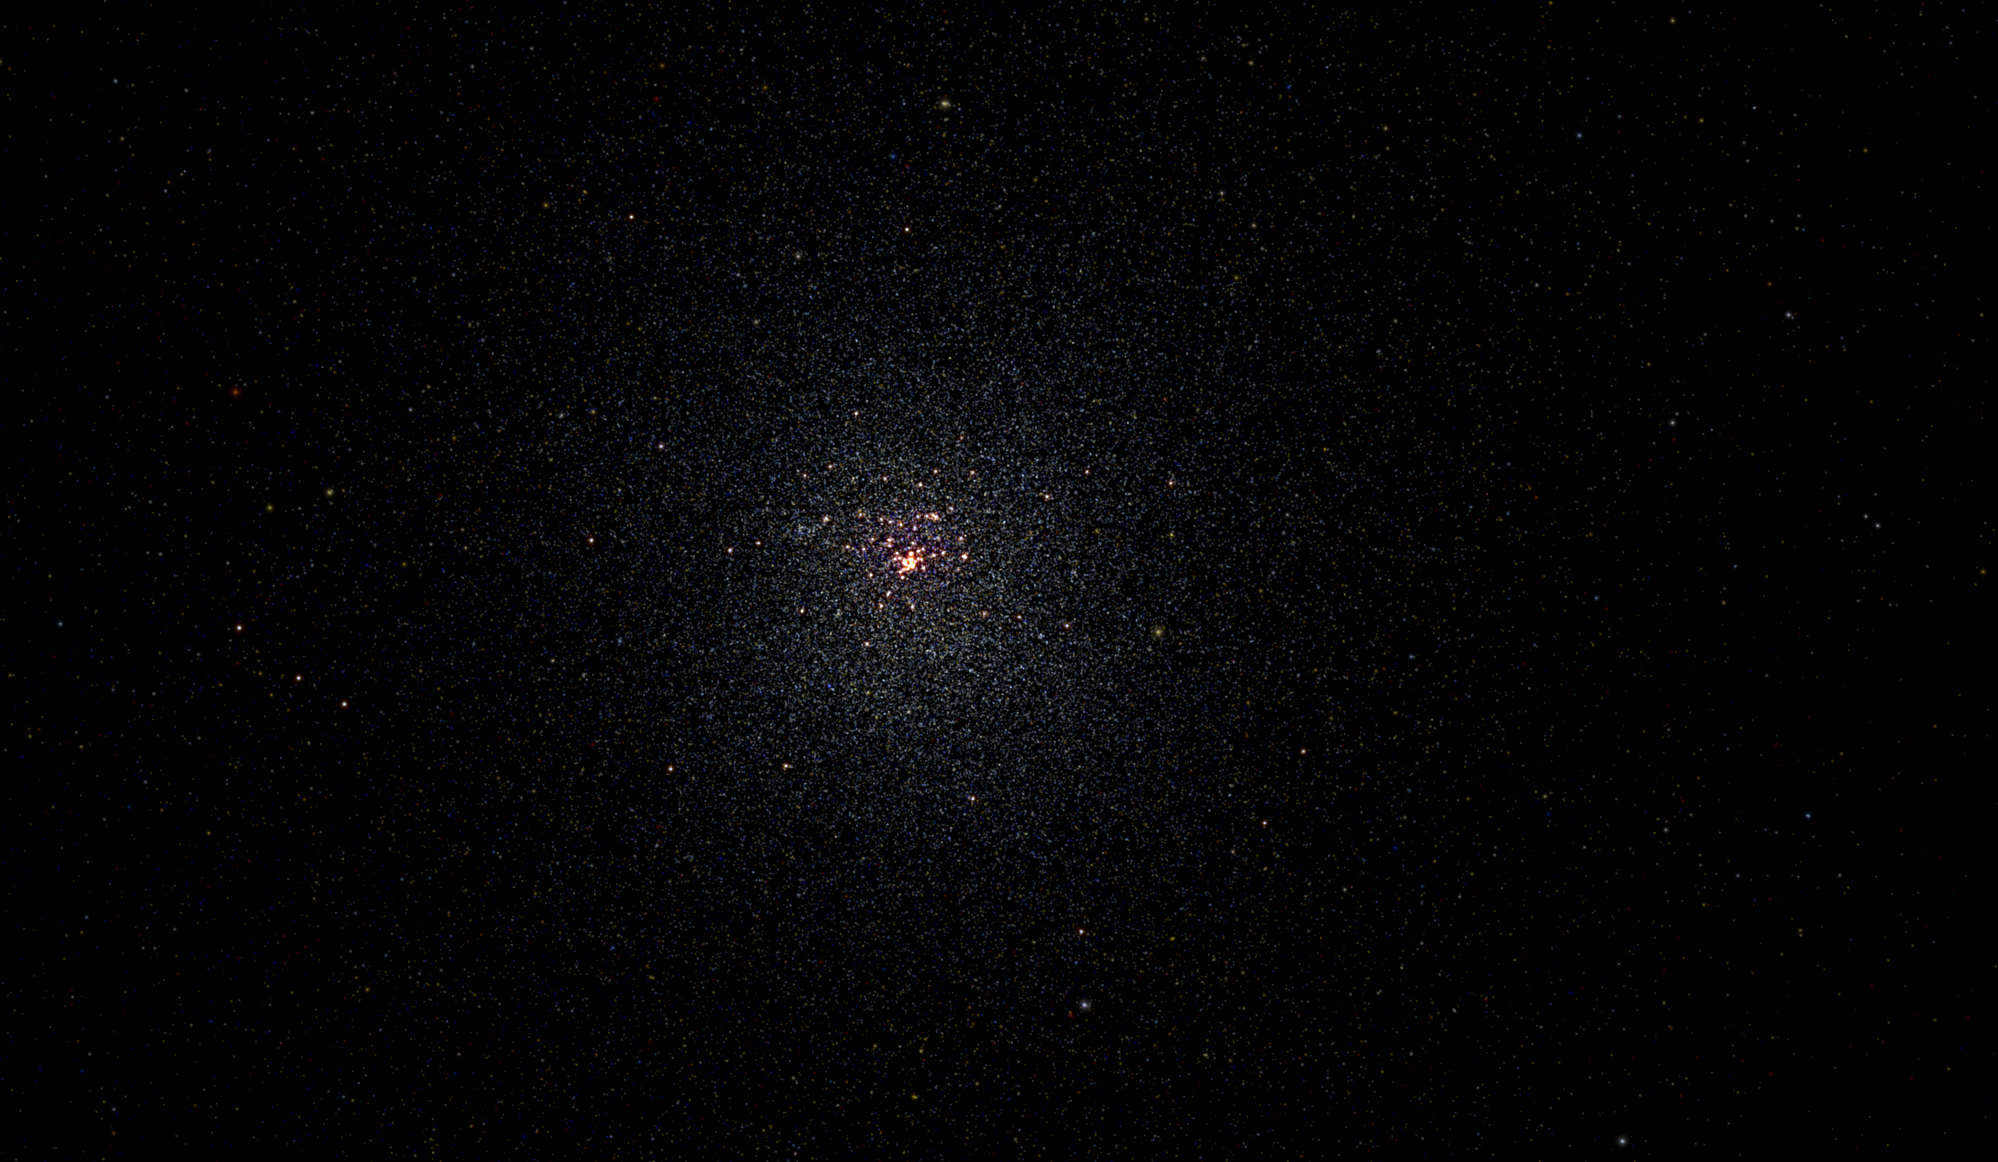
- I found some three.js examples that use 3D models in a 3D environment. I experimented making some 3D models of “bacteria” (my own artistic interpretation) and showing a randomly distributed set of “bacteria” in a 3D environment. See attached images. This data visualization experiment is not tied to the data set yet as I am still thinking how to link pathway abundance data to an interesting visual.
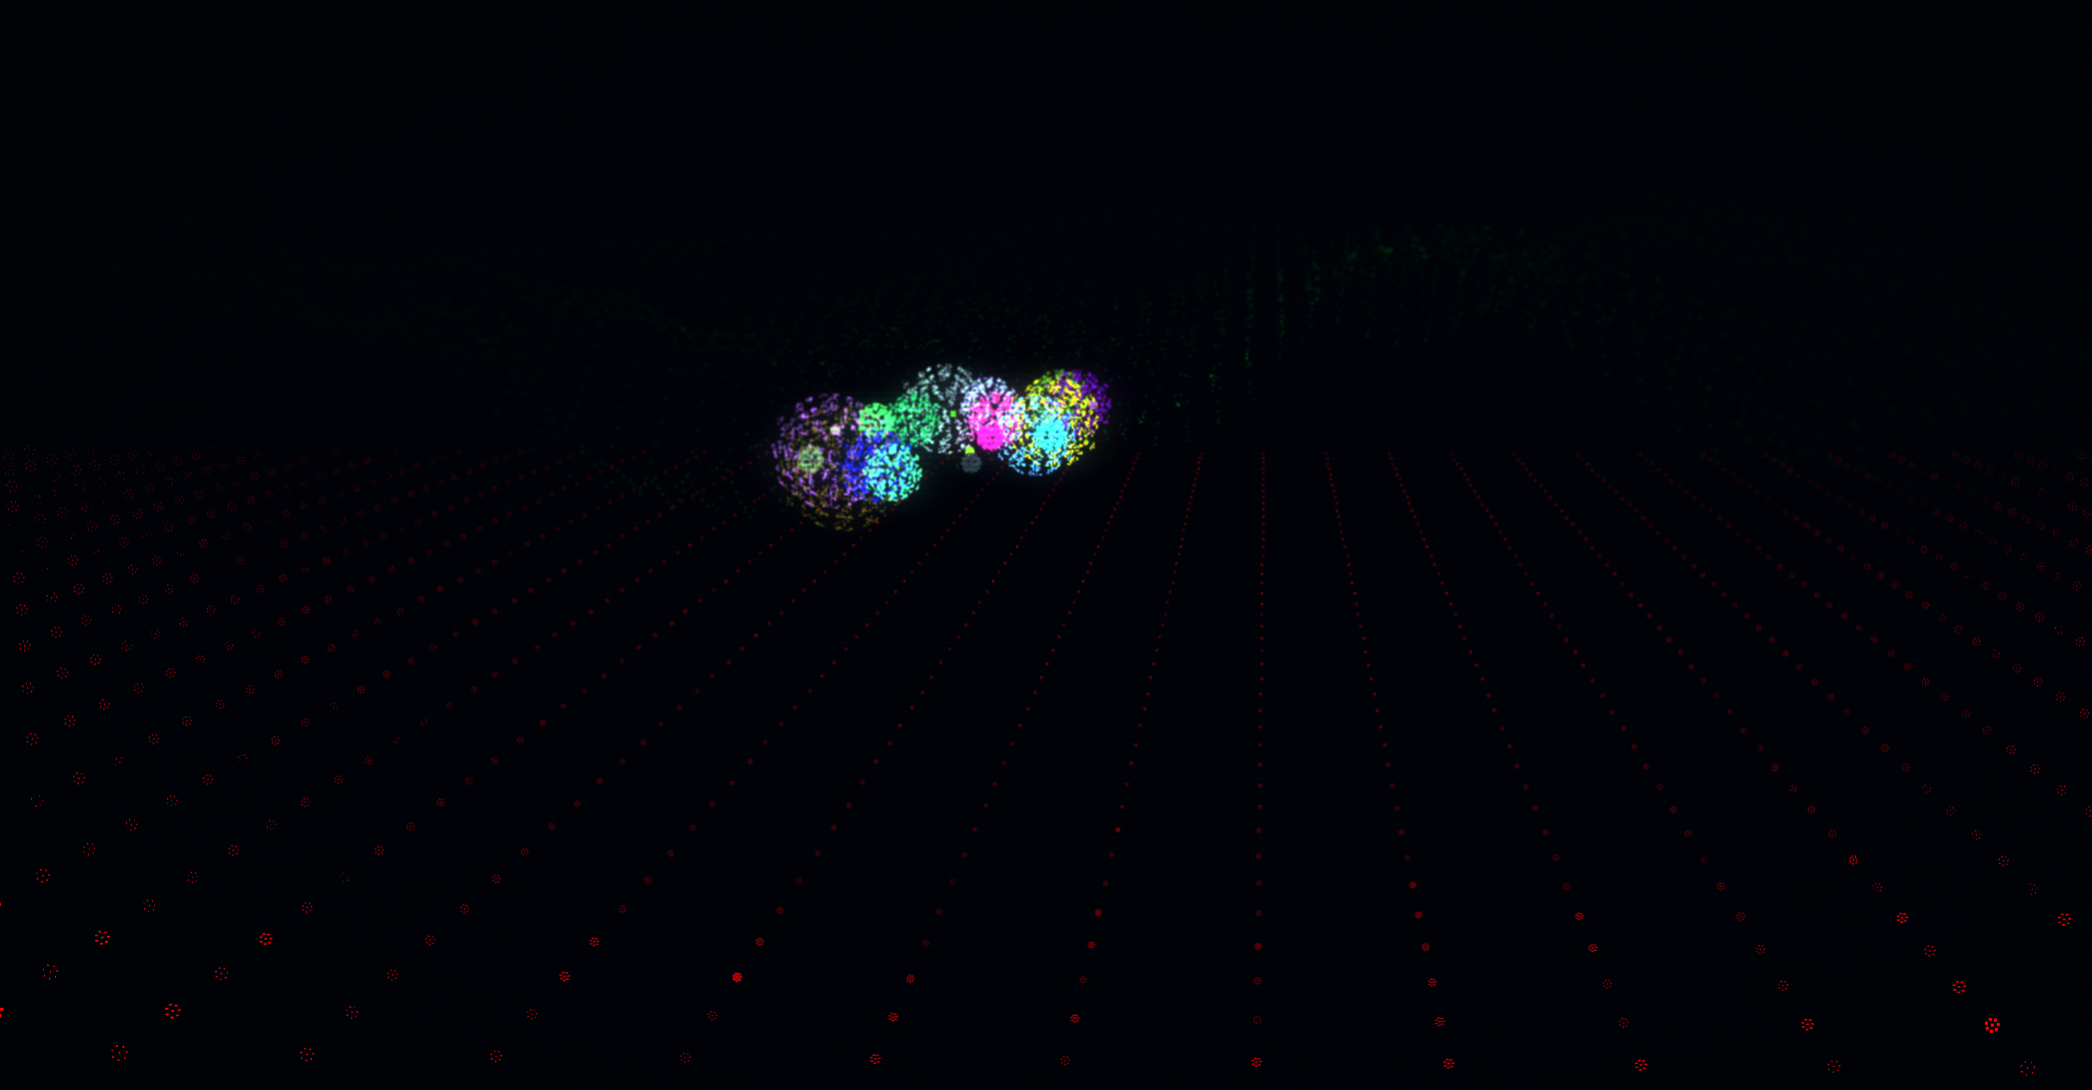
- I did another experiment looking at openFrameworks mapping a particle system to the size of the abundance in the sample (by location of hive). I am still working on this and putting the final touches.
- These later experiments are still works in progress. I will have more to show on Thursday. Note: these are interactive which gets lost in 2D images.


Final User Test:
Please describe what technical variable you are testing or experimenting with for Thursday, why, and how.
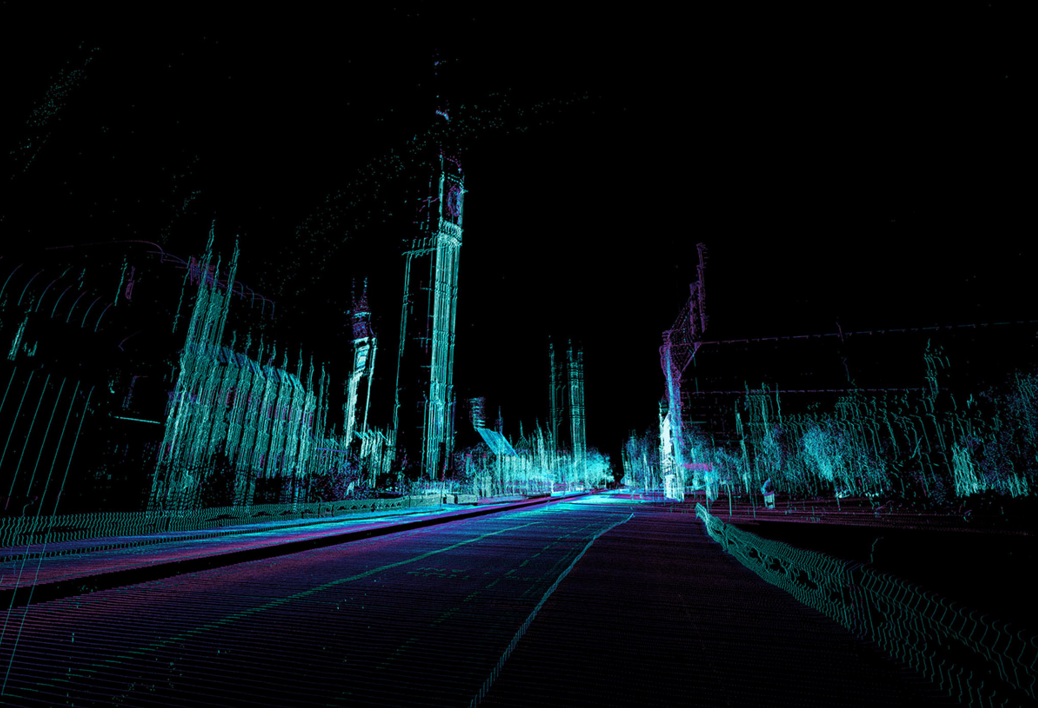
For my final prototype I am working towards making an interactive web-based experience that will enable the user to visually explore the data. Using three.js, I will use Patricio Gonzalez’s Skylines library as a basis for this work. Initially I will create a mesh terrain and wrap a custom shader (using GLSL language) to create visual effects that give the user the sense that they are flying through the built environment, but the built environment will look like clouds or shadows (i.e. not rendered). Taking inspiration from the below precedents, I will overlay a particle system on the terrain. Each particle will be mapped to a microbe from the data. The user will be able to click on a particle and see what it is or search a location and see a set of particles levitate or move in some way. Using this 3D web technology, I explore the idea of scale by allowing for rapid zooming in and out.
For Thursday, I will have a first iteration complete:
-Base terrain
-preliminary shader prototype
-basic functionality
Please also describe how this experiment underscores your overall thesis idea.
My overall thesis concept is about generating the microbial “finger print” of New York City and exploring the relationship between humans, the human microbiome, and the microbiome in the environment (specifically in the four neighborhoods where that serve as the test-beds for the science experiment).
One of the core question I am asking is: how can we visualize the microbial world around us? While I am still researching the implication of this data (i.e. what can we learn about the humans living in this neighborhood by understanding the microbes present?), this final prototype is the basis for the visualizations that will allow the user to imagine this world.
Precedent Images: