The HipHop Project: Translating Rap Lyrics into Art Encounters

Link to the website: http://www.rappersdelight.nyc/splash.html

The HipHop Project is the culmination of a month long research project in data visualization. It explores a variety of academic concepts including the museum as medium and contemporary black culture as a "fluid amalgamation of reciprocal influences: fine art overlaps with music, music overlaps with literature, literature overlaps with dance and beyond." 

Rapper's Delight is a project undertaken as part of work for the Media Lab at the Metropolitan Museum of Art. Using the words from rap lyrics as key-word searches through the Met's digital archive of over 200,000 works of art, users can experience a curated "tour" of the work at the Met. 

This project could engage any visitor who love rap music and provide them with a unique lens through which to view the museum's collection. It could allow visitors, who are already familiar with the Met, to see work that they may not have otherwise known existed. However, the key audience for this project are the young men and women who live just a few miles away who may have never had the opportunity to come to the Met. Rapper's Delight, is a way to offer the Met through the lens of the poetic and culturally relevant music that is Hip Hop and to engage in contemporary black culture.

The website URL RappersDelight.nyc is playing homage to the song Rapper's Delight by The Sugarhill Gang, largely considered to be the song that popularized Hip Hop music. 

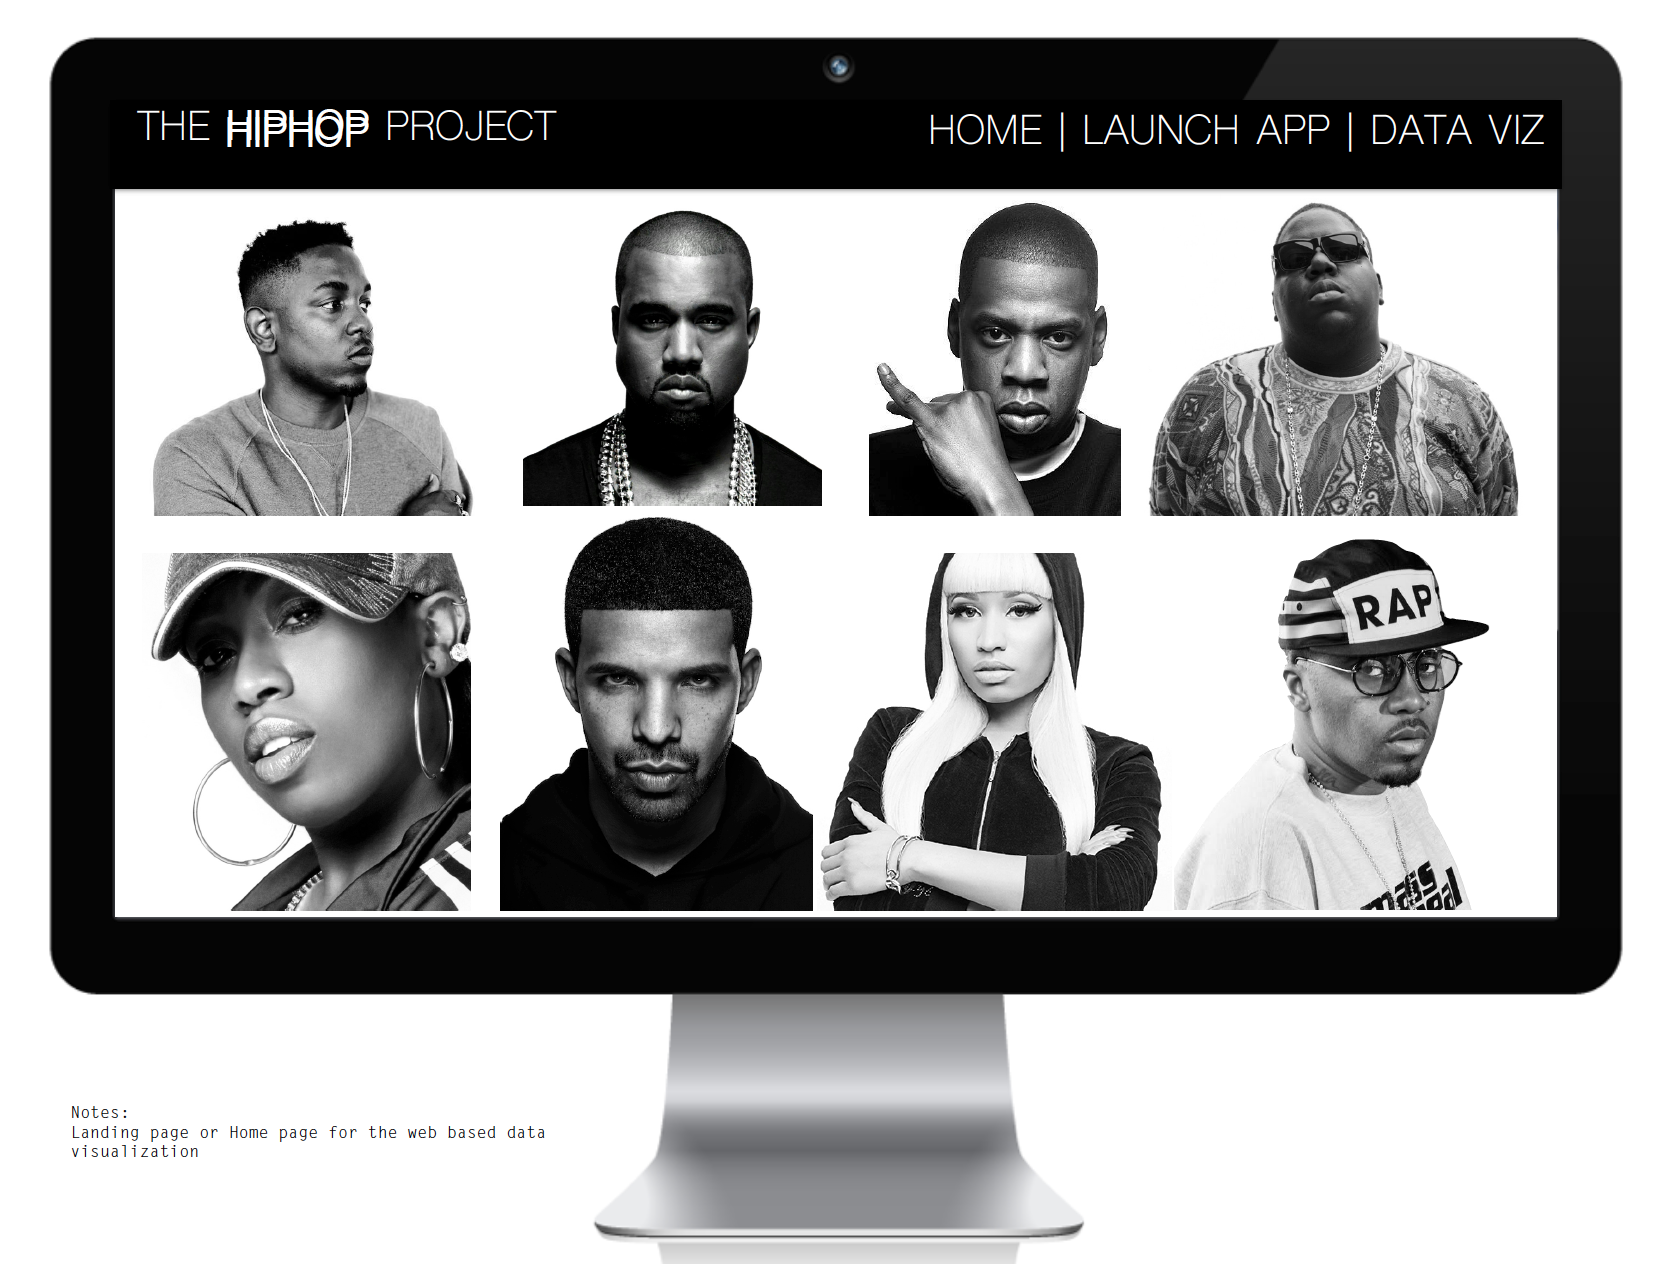
An ethnographic research study was conducted to determine the 13 rappers used in the project. Participants were asked two questions: (1) who their favorite rappers are and (2) who the most influential rappers of all time have been. The participants in the study are a group of cultural influencers including a Grammy Award Winning R&B singer, a comedy writer (and D.J.) who is known for writing on Late Night with Jimmy Fallon and HBO, and a crew from The Baisley Housing Project in South-Side Jamaica, Queens who are community leaders and activists.

This was accomplished using Javascript and was created using the Rap Genius API developed by Eddie Forson, the website Rap Genius, and the Met's API developed by the Met's Digital Media department. 

API Links:

Rapper's Delight: Hip Hop Curates The Met

Using words, phrases and meanings from rap music (rap genius api), I will create curated visualizations of the work on display at the Metropolitan Museum of Art (Met api). This is a way to engage visitors who love rap music and help frame their experience through a unique lens.

Unfolding Maps in Processing

This is a continuation from my last blog post on earthquakes. 

I added more elements to the map:

  1. Full map (not just CA)
  2. Marker differentials based on magnitude
  3. A dropdown menu based on type of quake for UI
  4. Interactive sound - as user zooms in the sound becomes louder

I also attempted to use mouse-over labels on the data points but I struggled using "LabeledMarker.java" in the ControlP5 library from Processing. 

I also played with different methods for pulling data:

  1. Using csv file 
  2. Using Atom Syndication (link) and the RSSReader in Unfolding Maps 

Earthquake Data Visualization

Growing up in California one of the biggest life-changing moments for me was the Loma Prieta 1989 Earthquake. So when thinking about this assignment I wanted to somehow capture the human impact of an earthquake. I did not want to just display data, but connect it to the (sometimes) horrendous nature of these events. 

I thought by incorporating sound of the visualization that would immediately connect the user to the human tragedy. I pulled a soundtrack from a YouTube clip of the footage from that day in 1989. For me that was the starting point for this assignment. 

Data Parsing:

I decided to look only at the California data because I wanted to do a project on my home state. 

I pulled the All_Month data from the USGS (http://earthquake.usgs.gov/earthquakes/feed/v1.0/csv.php) website and decided to look only at monthly data. 

I pulled the data into Excel to look at it and get a sense for what was going on. I ran some basic analytics on the data and realized that one county accounted for 22% of all earthquakes in the state of CA. 


I then wrote a script in Processing to parse the monthly data by the county "The Geysers" and only looked at "earthquake" data. Note that the full data file includes "explosions" and "quarry blasts". 

Once the data was parsed and I was only looking at "Earthquakes" from "The Geysers", I was able to get started with my visualization. 

I was very interested in using the Latitude and Longitude positions from the data tables. I used a library called Unfolding Maps that allowed me to easily make use of the positions through a function called "Location". 

I also spent some time looking into p5.js but I could not find a map library to use. I think for a future iteration of this type of visualization I would like to experiment with the Google Maps API or another maps library such as Leaflet (http://leafletjs.com/). 

http://a.parsons.edu/~florr422/DataViz/homework3/

I spent a lot of time having issues with my p5.js code until I realized that some functionality does not work unless you setup a local server. Please see my detailed README file here: http://a.parsons.edu/~florr422/DataViz/homework3/README.md

Data Analysis

Data Viz Assignment 2: Exploring CMS data. The dataset contained over 3,800 records. To clean the data I aggregated the 'Interest Value' and 'Dollar Amount Invested' columns by 'Recipient State'. One record was discarded because no State was provided (seemed to be a non US recipient). Once the data was aggregated there were 49 records (note: no HI, no AL and includes DC). I then broke the states into 3 buckets based on total Interest earned. I arbitrarily chose the bucket size to be: 1) greater than $10M, 2) between $10M - $1M, and 3) less than $1M. 

I choose to map this data on US map rather than in a bar chart because I thought it was easier to see the distribution on interest earned in this visual context.

Next step: I would like to add a mouse-over that would show the dollar amount by state. 

Data Visualization: Clock Processsing

This is a visual representation of a clock using no letters or numbers to inform the user the time of day. As you can see from the below image, the hour hand is the inner most arc, the minute hand is the middle arc and the second hand is the outer most arc. At the time of taking this photo it was 10:15pm. The inner arc shows 10, the middle arc shows 1/4 of the complete circle thus denoting 15, and the outer second hand is at half way to completing the circle denoting 30 seconds. 

Data Visualization: Creative Clock Assignment Preliminary Sketch

Preliminary sketch of my re-imagination of the clock. My first thought was to play with this idea of brain activity through the day and a connection to the circadian rhythm. I had wanted to either play with the BCI devices or a wave shield, but I was unable to get my hands on one in such a short period of time. I also investigated existing data sets for 24hrs worth of brain activity, but I was unsuccessful in locating an appropriate data set. 

It would be an interesting idea to continue with this project. I would create a simulation of the sun in the sky and relate it to the brain activity in order to show time passing.