META Methods: Final Piece

Final paper here.

My final piece, the capstone of the <META>Methods research project, is entitled Why Do I Hate Myself?. It is an interactive, mixed-media piece combining performance, video installation and algorithmic art. It uses the data and algorithms from the prior two pieces but, by combining data with performance, adds a level of artistic interpretation. This piece is intended to inspire an emotional experience for users because the video is an abstract account of my personal journey with body dysmorphia. The data visualization accompanying the piece was created using a unique set of search words that deal with concepts related to the female form.

'<'META'>' Methods

Set Theory is a branch of mathematics that studies sets or the collection of objects. In relation to Big Data, the cataloging and the creating of collections of information is where this project begins. Viewing the world as a massive network, everything can be viewed a data point, but also, when collected, becomes part of a set. And what defines any data point is the metadata that defines it and links it to that set of data.

'<'META'>' Methods attempts to extract beauty and information from the superset of information. This projects looks not at the individual (micro) but at the whole (macro) and attempts to find relationships, whether contextual, graphical or mathematical, by examining metadata. 

This project also reimagines digital curation and asks the question: can a collection of digital assets become an asset, or work of art, in and of itself? Is metadata the “paint” that we can mix together, through algorithmic search, to create new “colors” in our digital “canvas”?

By applying mathematical theory to the analysis of a digital collection (set) of objects what new relationships can be uncovered and what new art can evolve?

ofxMetAPI Prototype 1.3

Taking inspiration from the Ted Sphere (http://www.bestiario.org/ted-sphere-project), this is a quick prototype looking at how to connect images. This particular iteration is looking at the objects that are NOT on display in any galleries.

ofMetAPI Prototype 1.2

 In prototype 1.2 I added more functionality to the add-on that makes it much faster. I built an image loader using the ofThreadedImageLoader function in oF which makes the downloading process much more efficient.

I also incorporated meta-data into the app so now users can access  fields like title, artist, country. So for example you could make a data visualization of all the artists at the Met, or just the art by a particular artist. I can't wait to see what people make! I'm going to go to the next OpenFrameworks meeting to promote it and try and get some of the guys/gals to use it and perhaps include that in my final paper/presentation. 

Example from the add-on loading thumb-nail&nbsp;images with meta-data.&nbsp;

Example from the add-on loading thumb-nail images with meta-data. 

Example from the add-on which loads large images and meta-data.&nbsp;

Example from the add-on which loads large images and meta-data. 

ofxMetAPI Prototype 1.1

Working on optimization of the API calls/responses to/from the Met's API. I built the add-on source code with some customized functions and started working on some examples to build out the functionality. In this case, using the API field "image_thumb", performance is improved significantly. 

This clip shows a very quick retrieval of 500 images over multiple pages (using the pagination functionality). 

ofxMetAPI Prototype 1.0

I am working on an OpenFrameworks add-on called ofxMet. 

ofxMet is an add-on for openFrameworks (v0.8.0+) that allows users to access the Metropolitan Museum of Art's API in C++. The add-on lets you pull data from the Met's digital collection such as image links and other information about an art piece.

Prototype I has incorporated the following functions:

  1. accessing Met API
  2. grabbing images based on search term
  3. pagination
  4. printing images to screen in a grid based on user defined grid size 
  5. scrolling 
Here is an example of searching "blue" in the Met's digital collection.&nbsp;

Here is an example of searching "blue" in the Met's digital collection. 

METAMethods Proposal

Presentation is here.

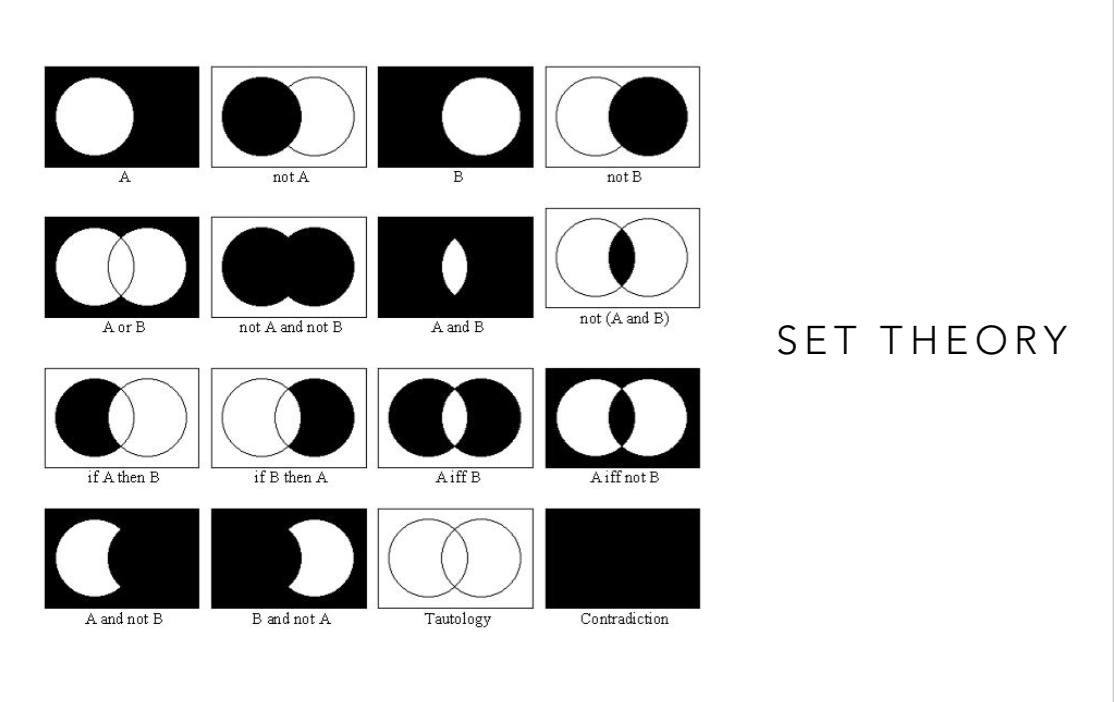
Set Theory is a branch of mathematics that studies sets, or the collection of objects. In relation to Big Data, the cataloging and the creating of collections of information is where this project begins. Today, we experience this phenomenon in entirely new ways. Our whole life is cataloged and archived. Whether it be a tumbler page, an Instagram page, a digital folder of the images of your life, or a digital archive from the Metropolitan Museum of Art, everything today is both a singular data point, but also, when collected, becomes part of a set. And what defines any data point is the metadata that links it to that set of data.

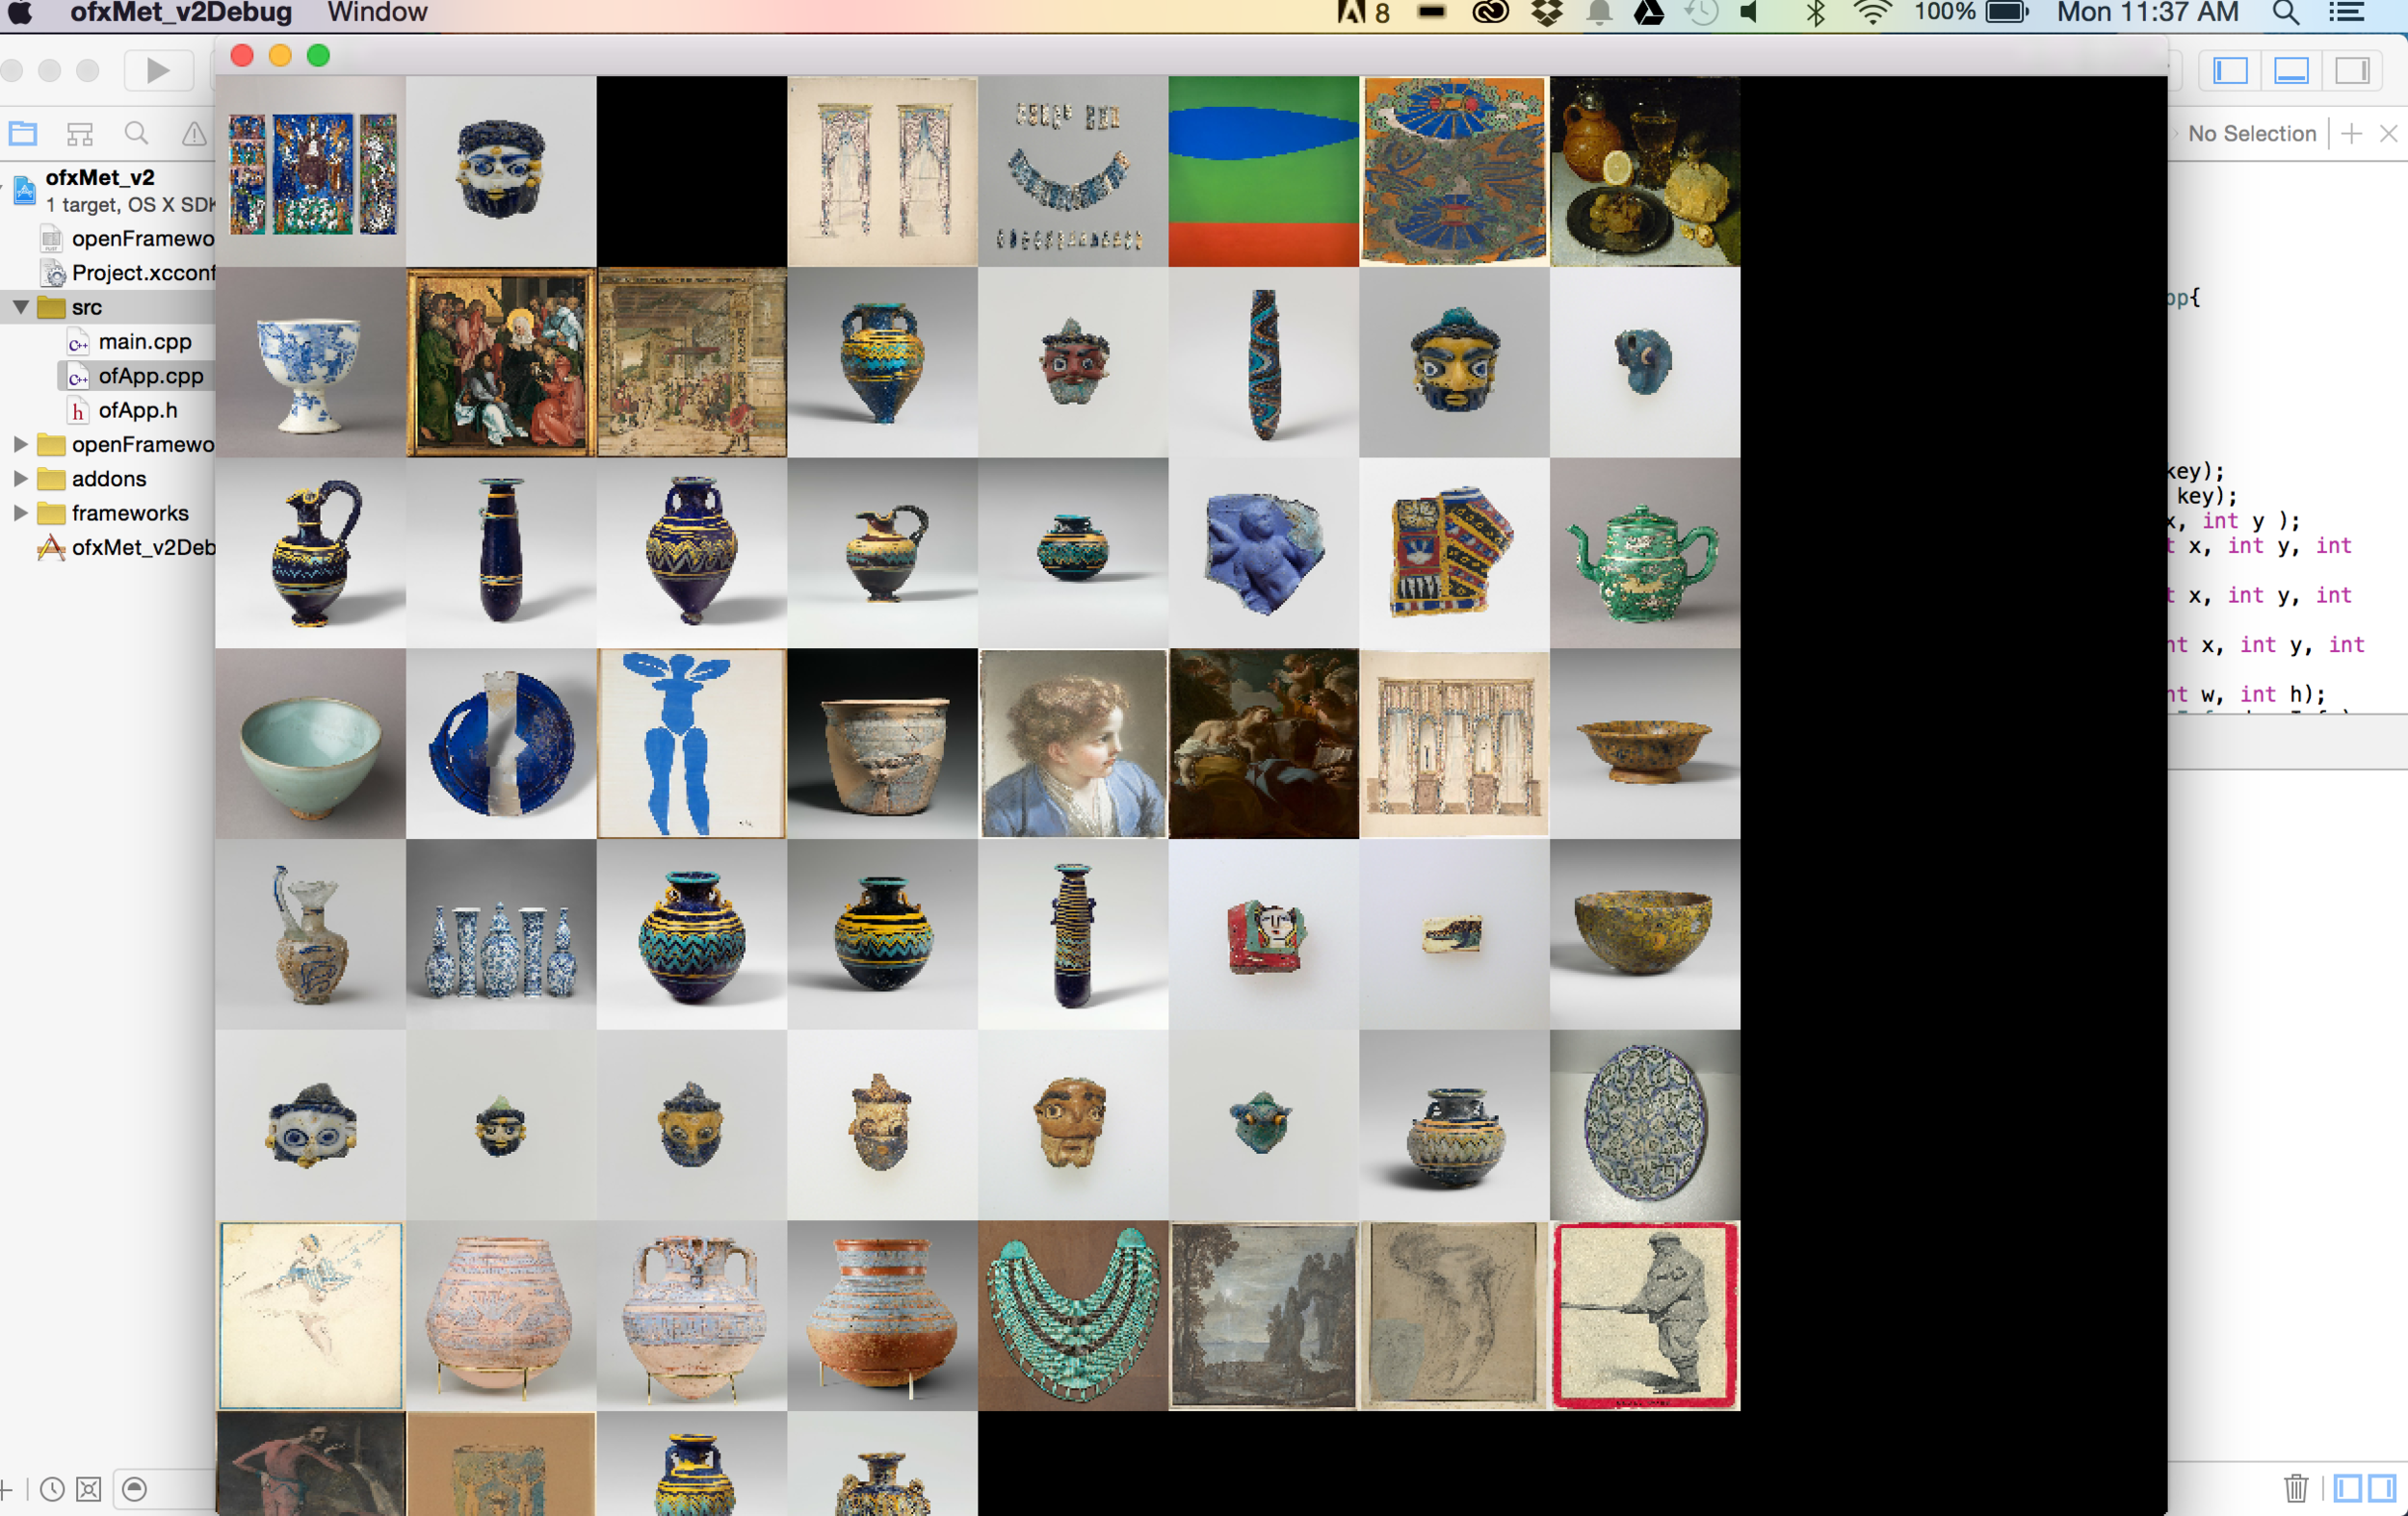
<META> Methods attempts to extract beauty in the superset of information. This projects looks not at the individual (micro) but at the whole (macro) and attempts to find relationships, whether contextual, graphical or mathematical, by examining metadata.

This project also reimagines digital curation and asks the question: can a collection of digital assets become an asset, or work of art, in and of itself? Is metadata the “paint” that we can mix together, through algorithmic search, to create new “colors” in our digital “canvas”?

By applying mathematical theory to the analysis of a digital collection (set) of objects what new relationships can be uncovered and what new art can evolve? If you look at enough metadata, would you find that the set is self-similar (fractal)?

THE JPG EXPERIMENTS

The JPG EXPERIMENTS became an exploration in coding. I am inspired by Big Data, Geometry and Algorithms. I want to explore ways to express myself through the medium of code in these areas of interest. This project was really an exercise for me to answer this question: How can I use this inspiration to express myself artistically?

The first iteration and project proposal can be found in this blog post. 

Here is the presentation for this project.

I attempted to make a data visualization in OF and using ofxInstagram add-on. I actually found a bug in the add-on code so I was not able to complete my project using OF. But, I ended up working with the developer of this add-on to fix the bug.  

This is a screen shot of the broken code. The main bug has to do with the Instagram API limiting the images to 33 and needed pagination to complete the call.&nbsp;

This is a screen shot of the broken code. The main bug has to do with the Instagram API limiting the images to 33 and needed pagination to complete the call. 

I ended up using js to make this visualization. Here is the javascript code used to explore the Big Data section.

I also wanted to experiment with producing physical objects as an output of the screen-based code. I experimented with printing and laser cutting on paper and wood.  

Visual screen based outcomes:

Using particle systems to map color in images

Using particle systems to map color in images

Looking at big data and how to visualize

Looking at big data and how to visualize

Algorithmic art outputs (Sol Lewitt instruction, N=10)

Algorithmic art outputs (Sol Lewitt instruction, N=10)

Physical object outcomes:

Laser cutting using wood

Laser cutting using wood

Printed on transparency paper to play with light and installation ideas

Printed on transparency paper to play with light and installation ideas

Laser cutting using paper

Laser cutting using paper

With a light source behind image

With a light source behind image

Experiments with Form

For this project I wanted to continue my explorations with image and pixel investigations. In this experiment I wanted to play with the form of the image as a way to make a commentary on the female nude. Here is the first prototype of my experimentation with the feminine form.

 Here is the PDF proposal for the project. 

Screen Shot 2015-02-12 at 4.16.23 PM.png
.

.

Experiments in Color 1.0

For my first project in Major Studio 2 I wanted to experiment with statistical models and creative coding. I had originally wanted to make an OF add-on, but found in the 1 week time frame it was better to produce a few experiments. I am really excited about marrying stats analysis with image processing. This idea is a nod to some of my previous work in astrophysics (see here). 

Here is a short pdf document that outlines the process: ofxStats

My code can be found here: https://github.com/reginaflores/ExperimentsInColor

3D model of RGB values:

Brightness distribution is calculated by summing up R, G, B values for each pixel: