Mycelium Experiments: Growing Building Materials

Ecovative is a company at the forefront of innovation by reimagining our world with products that are “grown” rather than “machined”. Opening up these materials to designers and architects is allowing for an ecology revolution where the harmful, toxic, wasteful industrial processes of the 20th century are being supplanted by green, virtually waste-less systems. This may be the key to the future of sustainable design and construction. 

Ecovative embodies their mission to “rid the world of toxic, unsustainable materials” by propagating the GIY movement. Just as the DIY movement has revolutionized open-source physical computing and hardware, the Grow It Yourself movement is making biology open-source and has even started a bio-hacking subculture. Ecovative sells mushroom material kits allowing everyone to experiment in growing their own products.

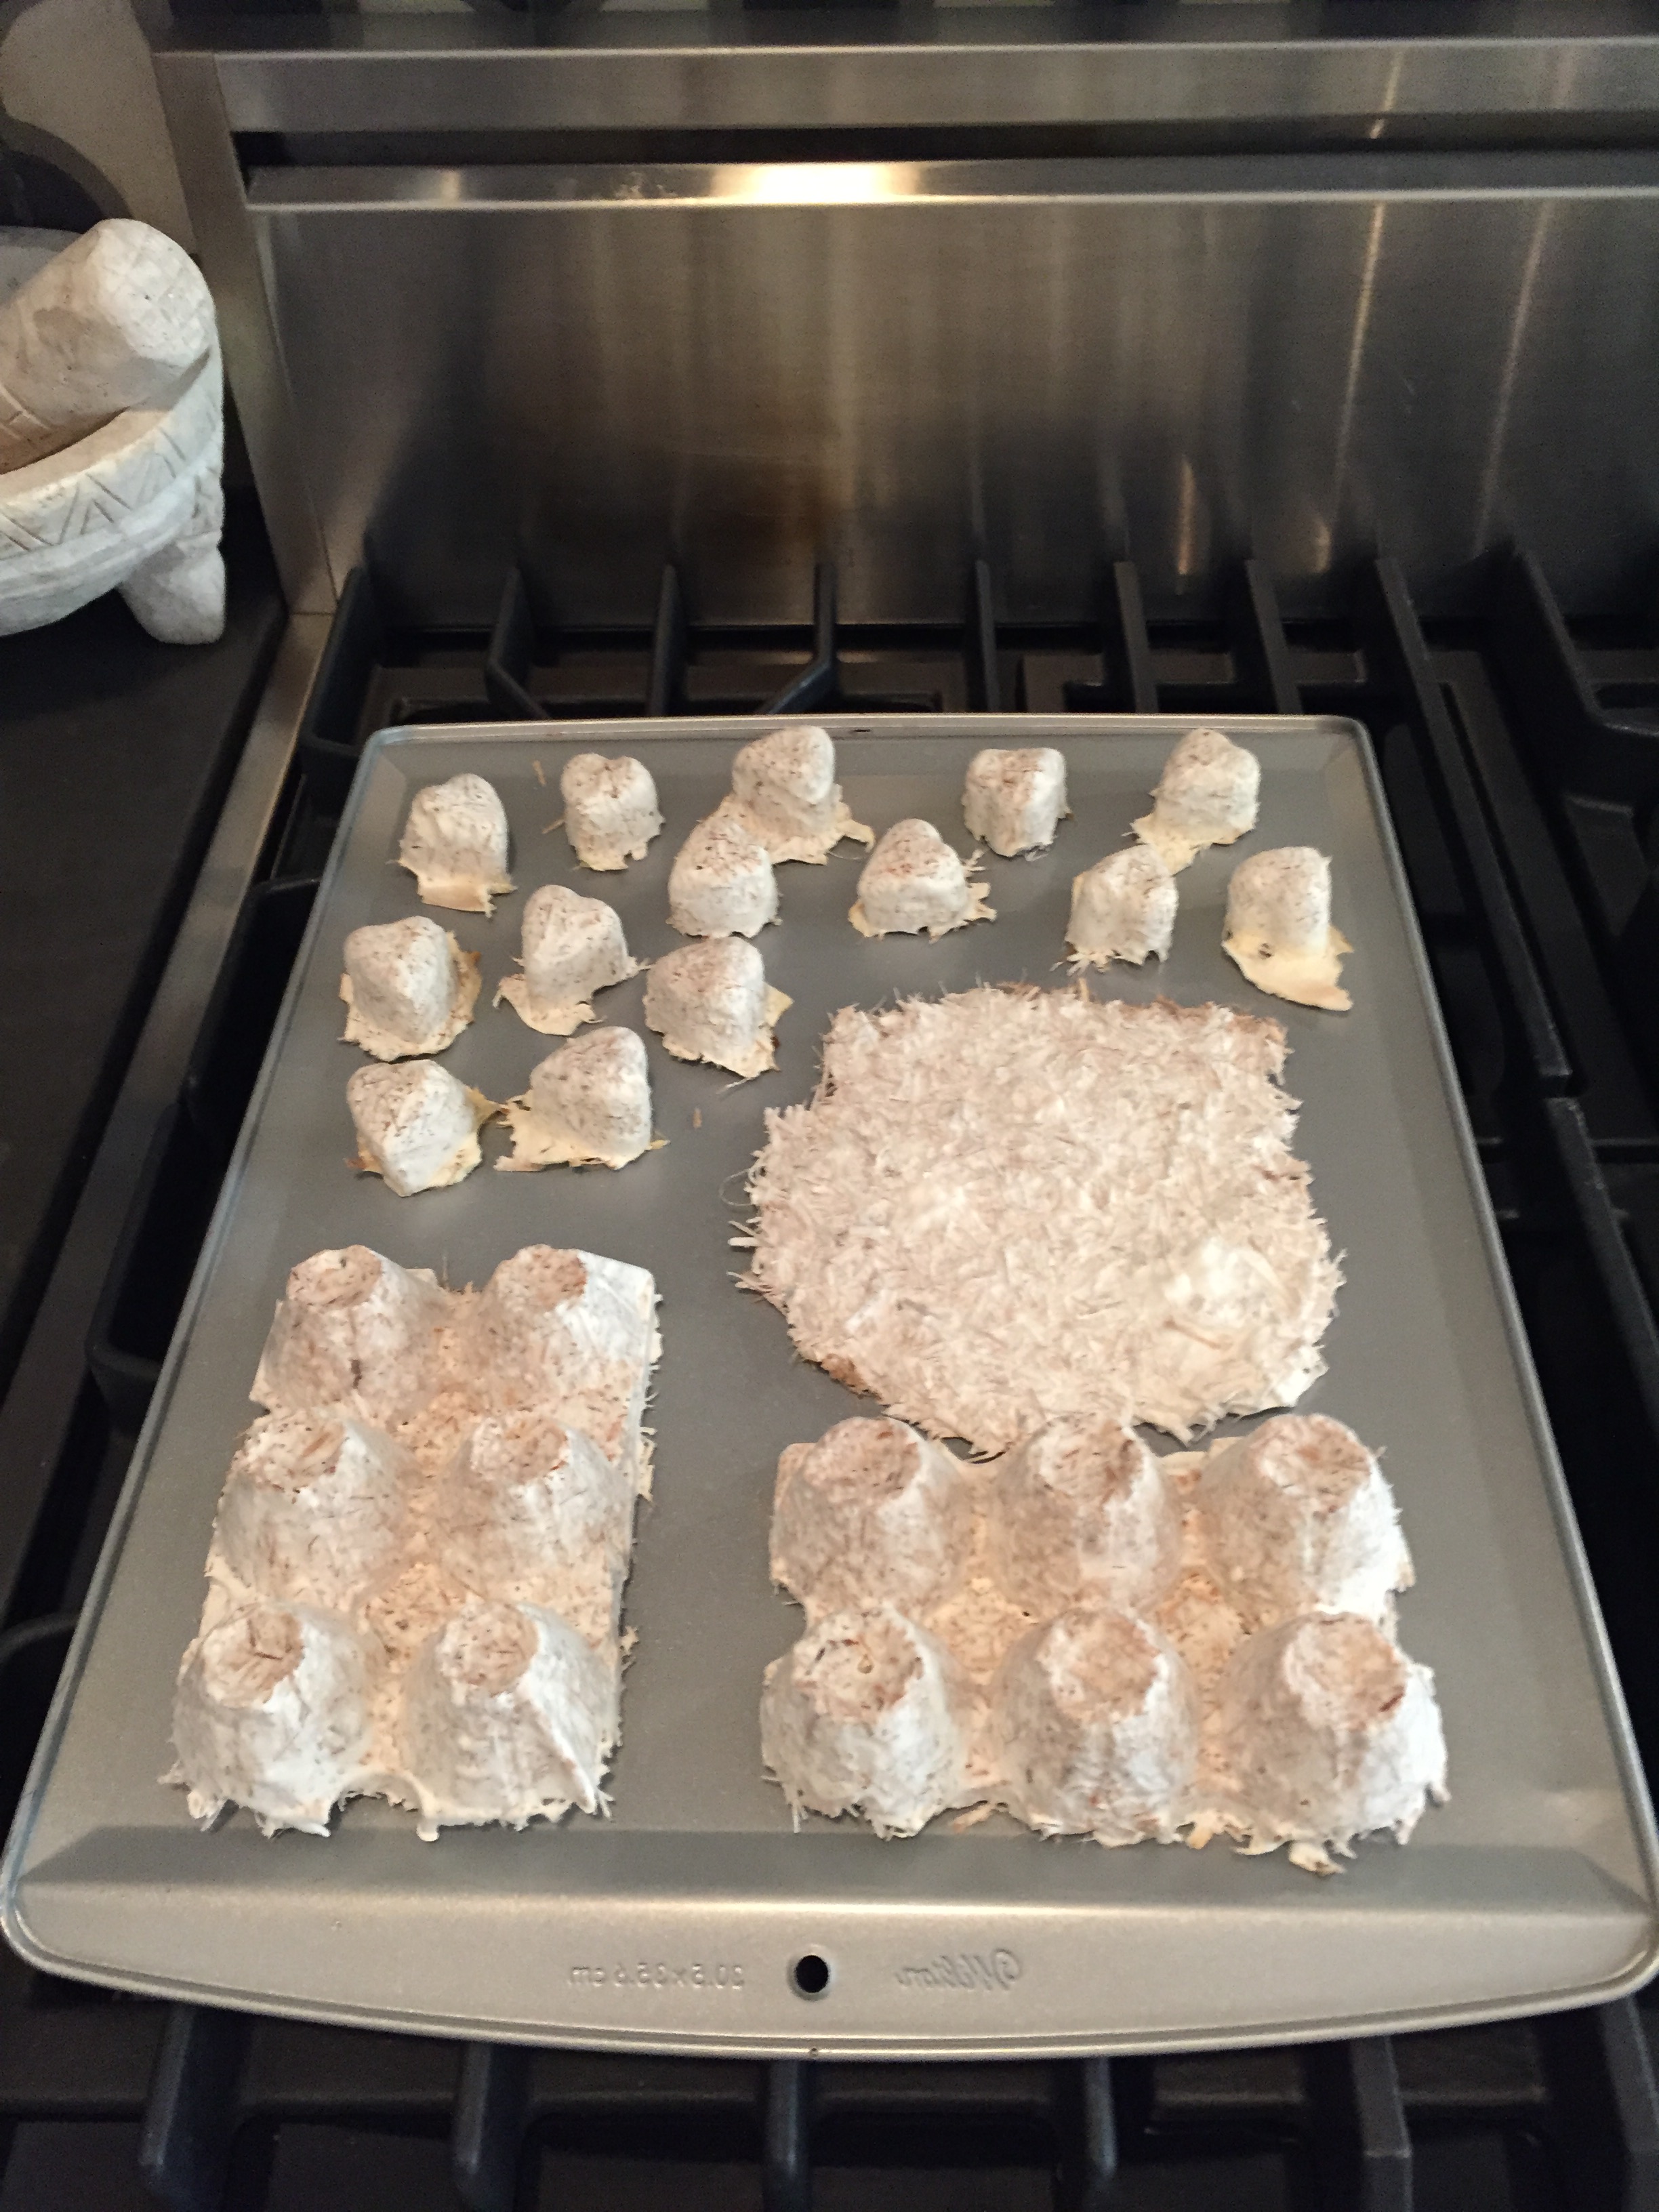
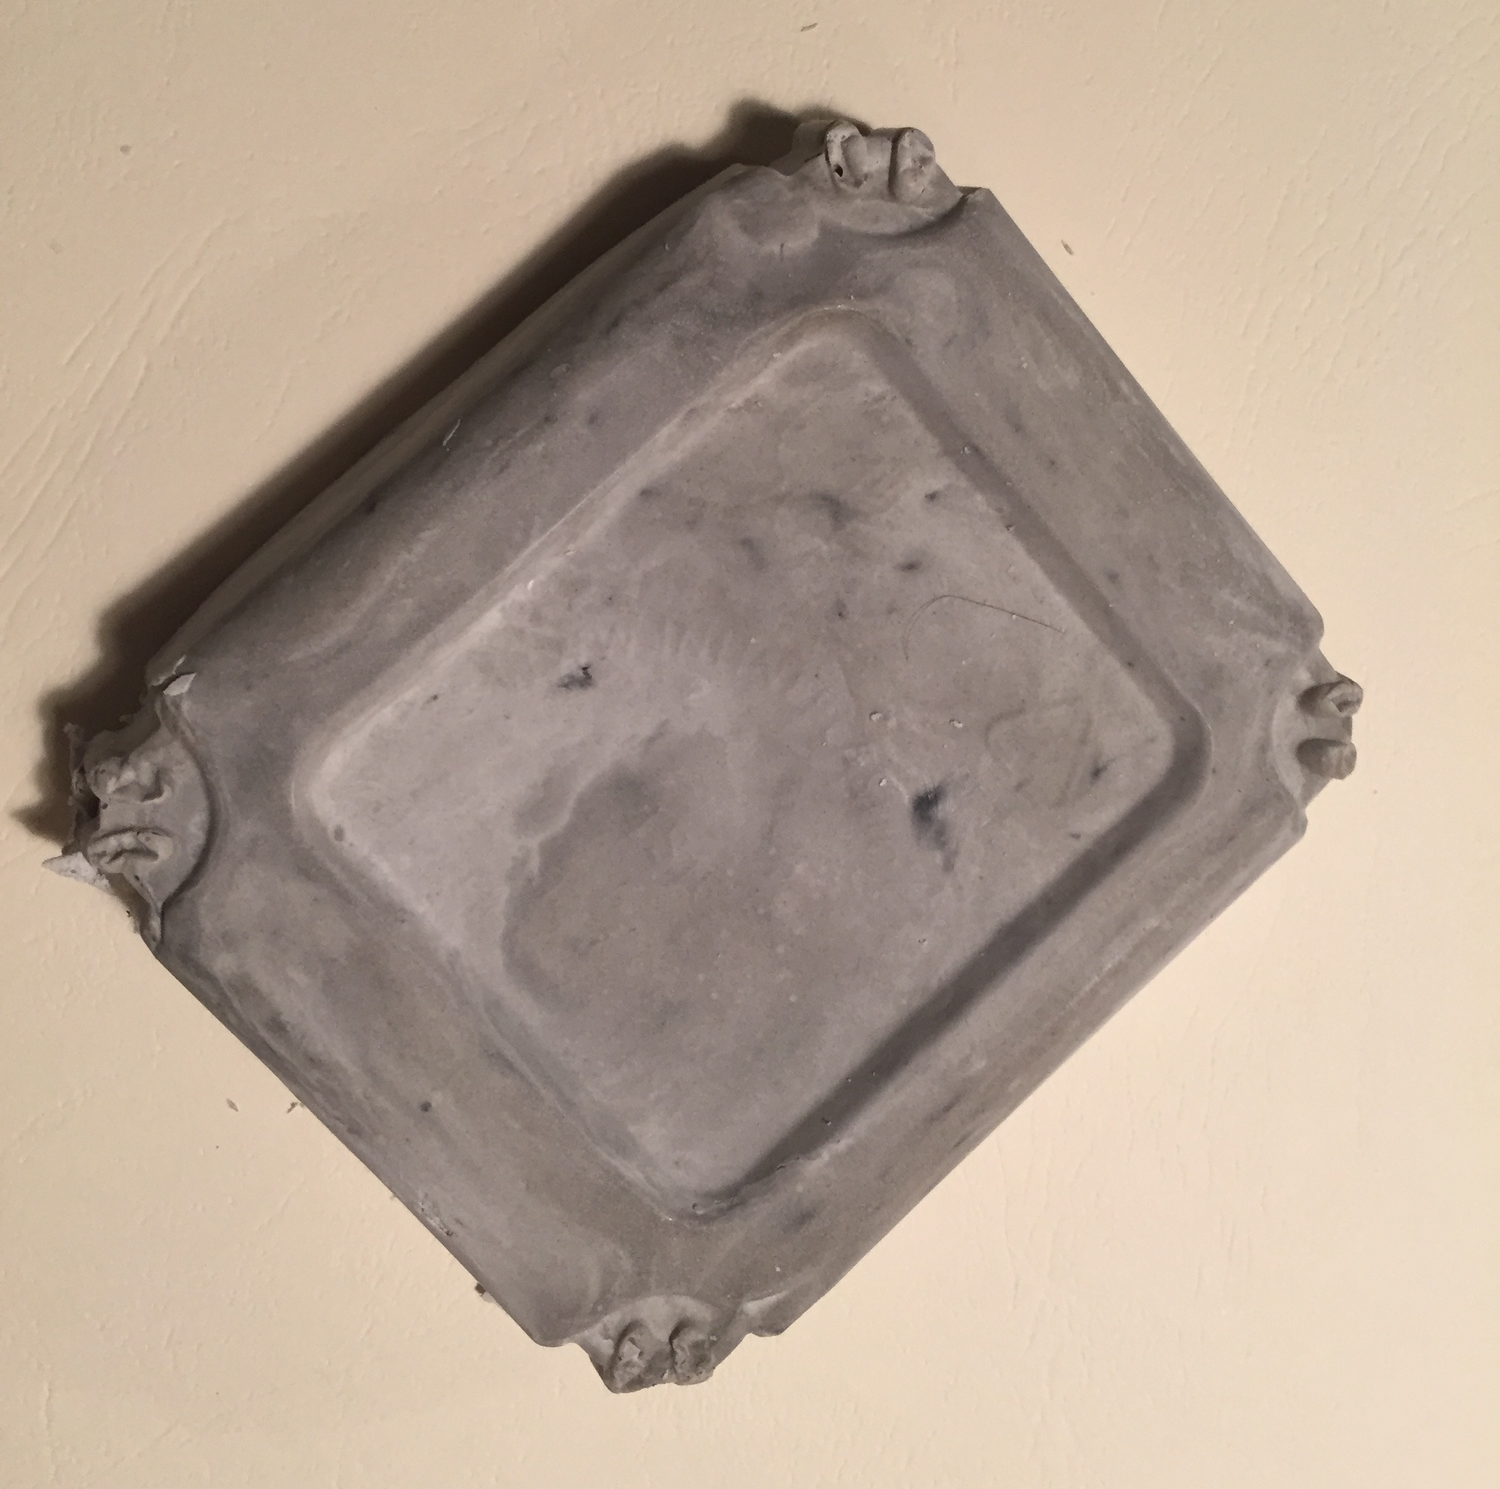
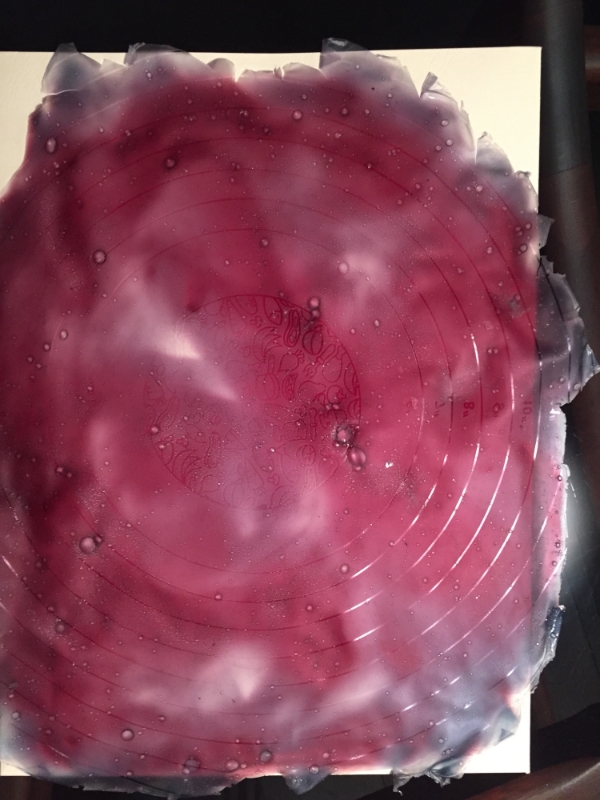
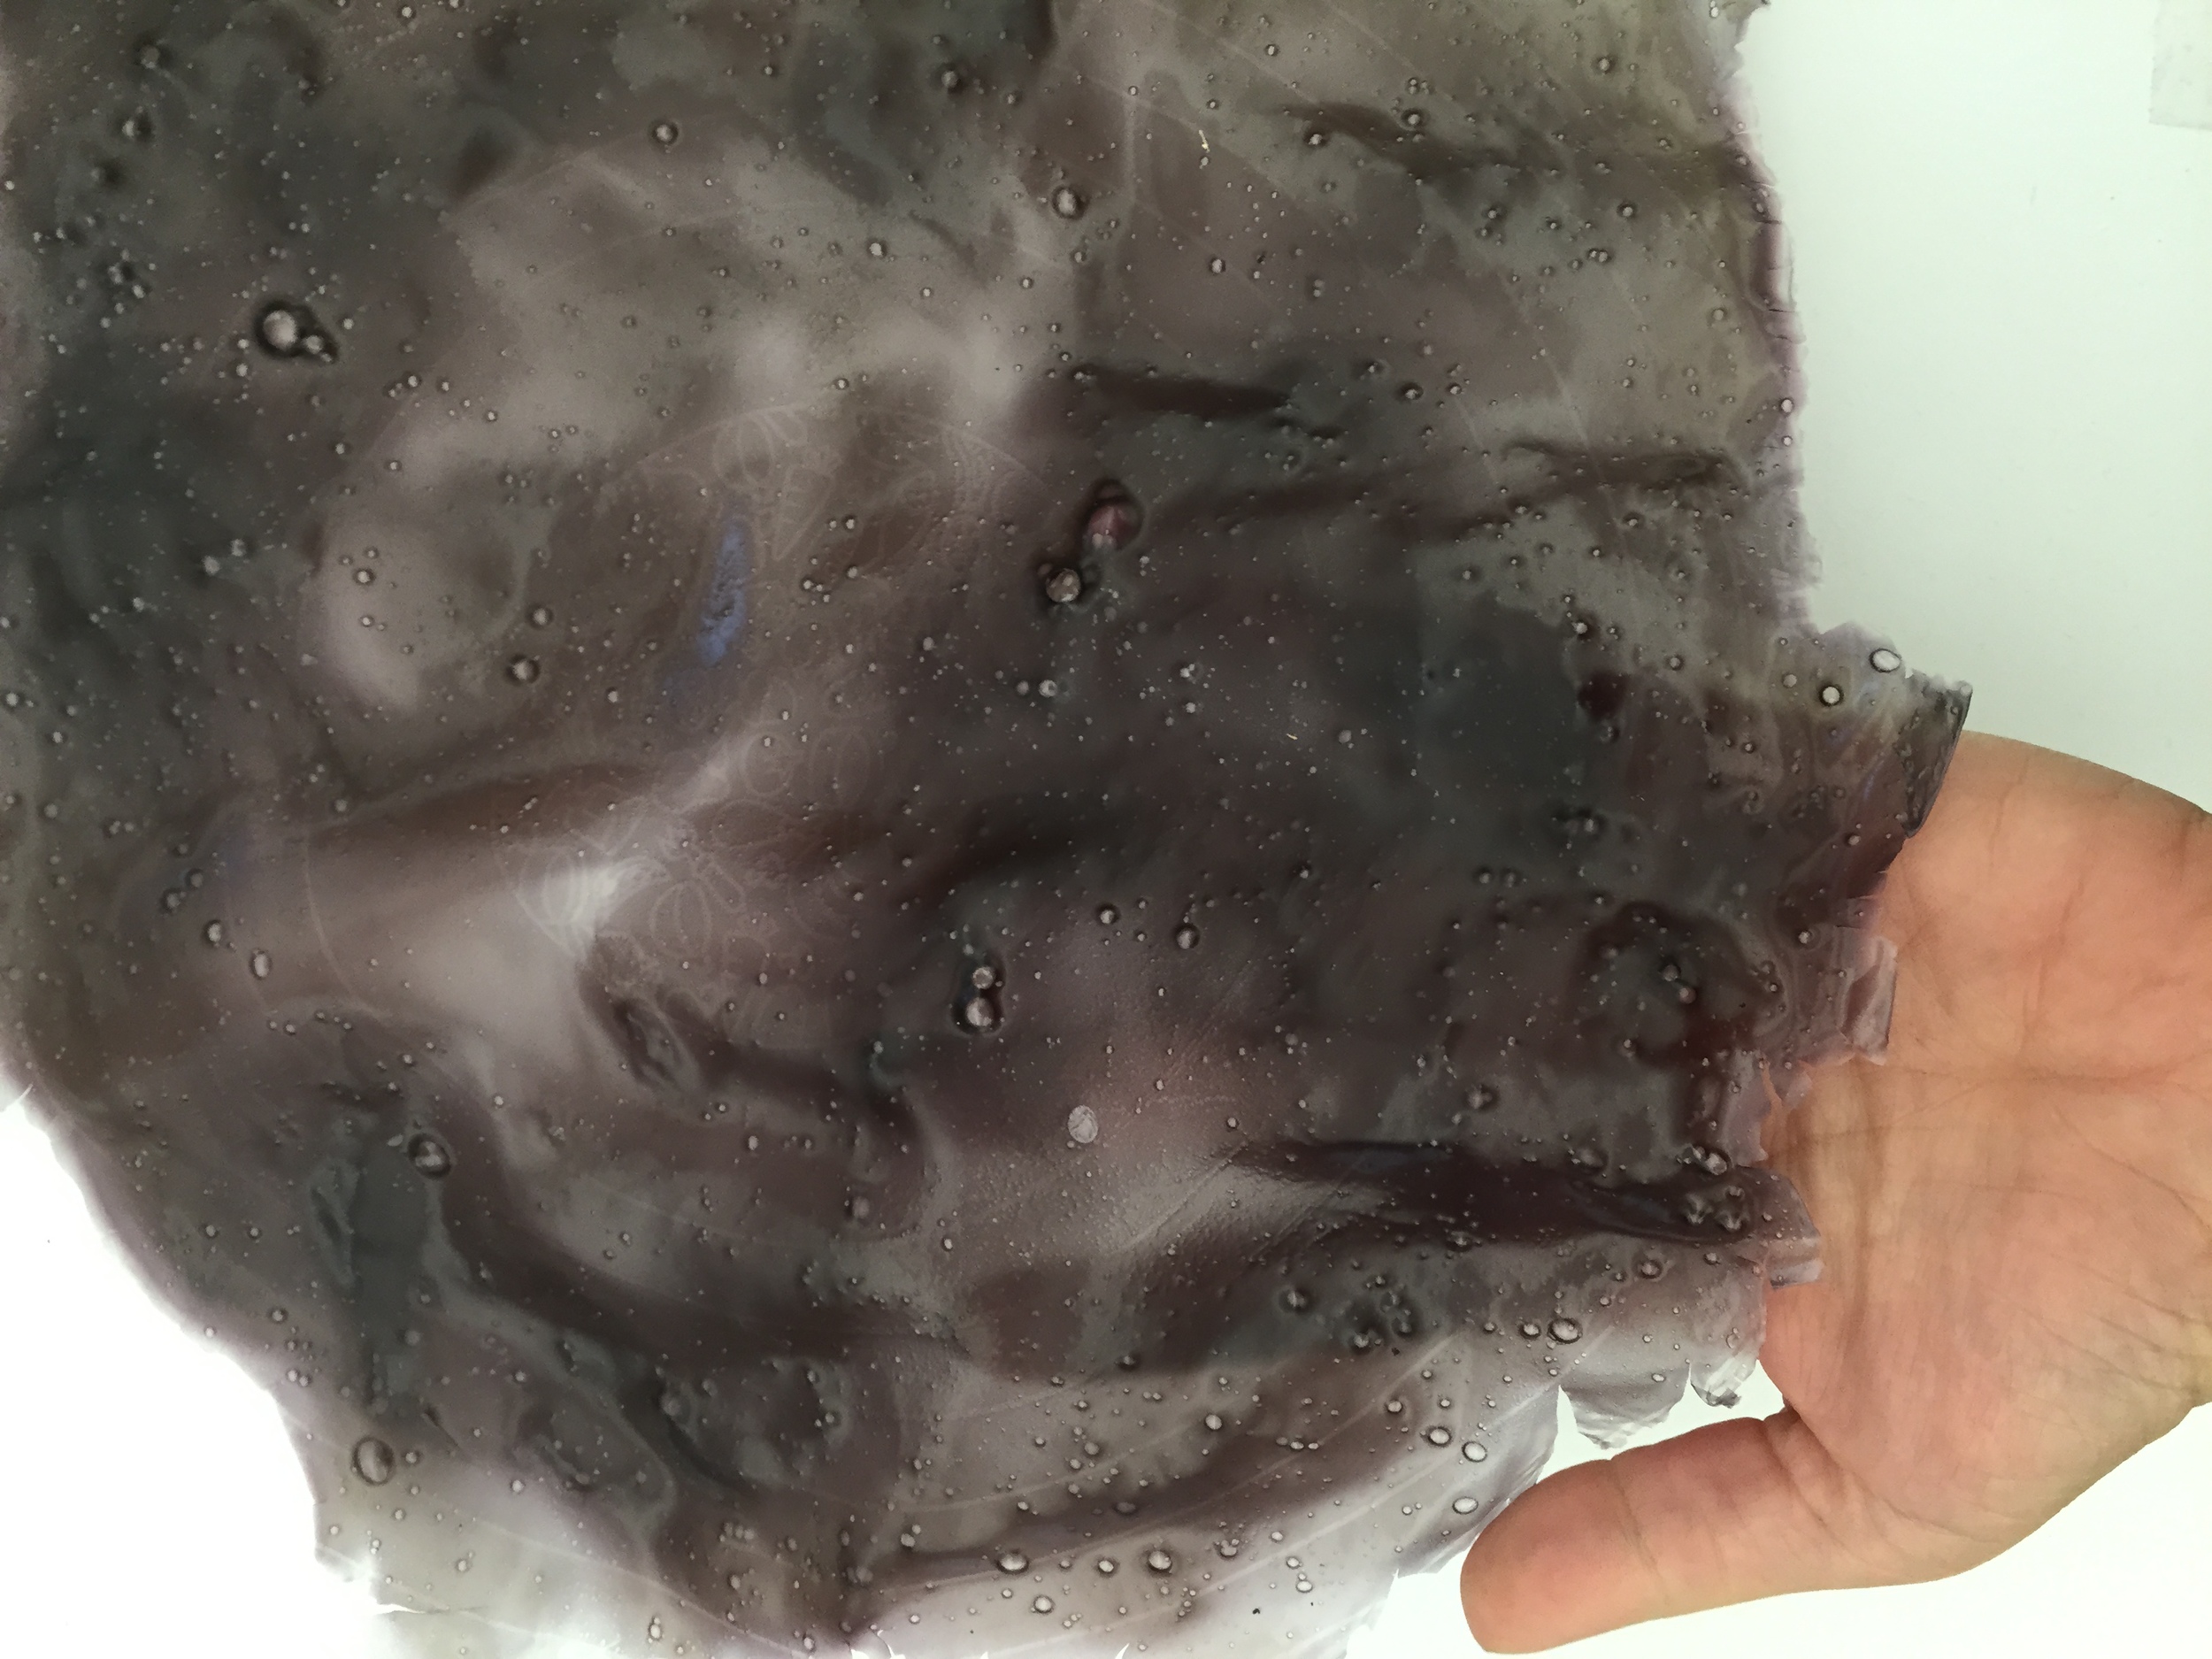
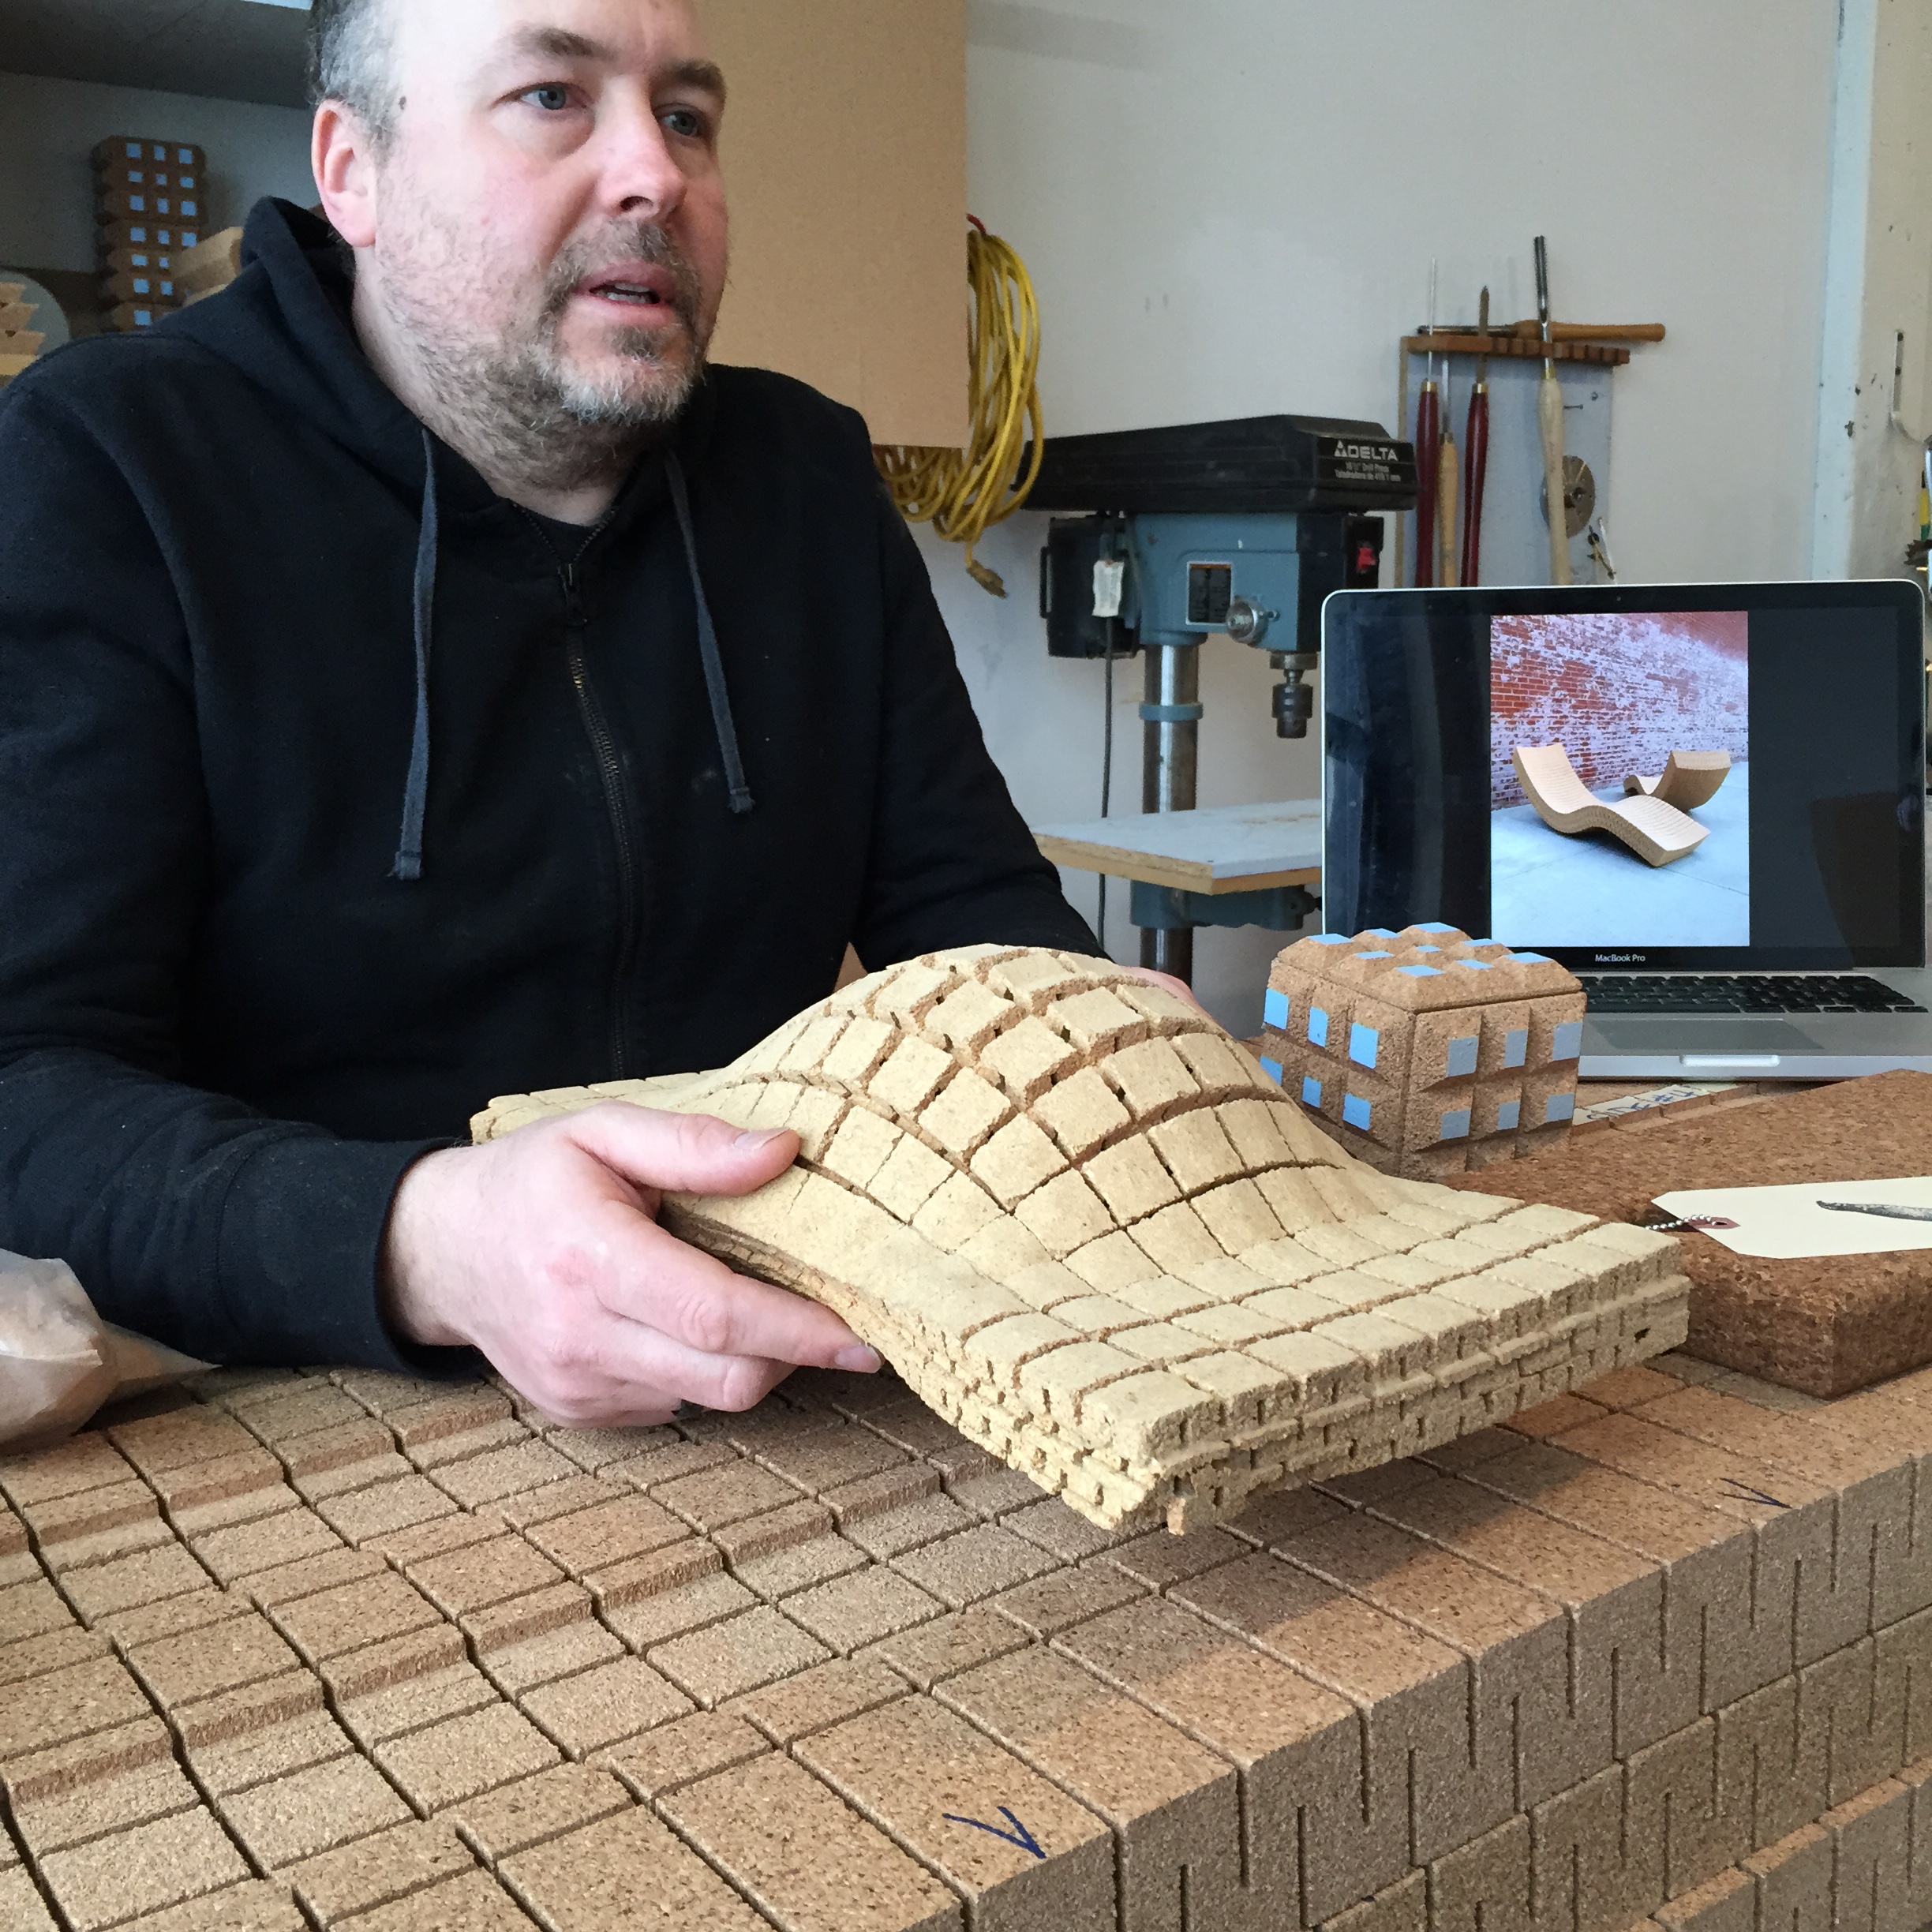
 Using the Ecovative GIY kit, I made a number of prototypes as a proof-of-concept that anyone can grow their own materials with 0% pollution, 0% waste and at a fraction of the cost of non-sustainable materials such as plastics. 

Here are some photos of my process:

ofxMetAPI Prototype 1.3

Taking inspiration from the Ted Sphere (http://www.bestiario.org/ted-sphere-project), this is a quick prototype looking at how to connect images. This particular iteration is looking at the objects that are NOT on display in any galleries.

ofMetAPI Prototype 1.2

 In prototype 1.2 I added more functionality to the add-on that makes it much faster. I built an image loader using the ofThreadedImageLoader function in oF which makes the downloading process much more efficient.

I also incorporated meta-data into the app so now users can access  fields like title, artist, country. So for example you could make a data visualization of all the artists at the Met, or just the art by a particular artist. I can't wait to see what people make! I'm going to go to the next OpenFrameworks meeting to promote it and try and get some of the guys/gals to use it and perhaps include that in my final paper/presentation. 

Example from the add-on loading thumb-nail images with meta-data. 

Example from the add-on loading thumb-nail images with meta-data. 

Example from the add-on which loads large images and meta-data. 

Example from the add-on which loads large images and meta-data. 

ofxMetAPI Prototype 1.1

Working on optimization of the API calls/responses to/from the Met's API. I built the add-on source code with some customized functions and started working on some examples to build out the functionality. In this case, using the API field "image_thumb", performance is improved significantly. 

This clip shows a very quick retrieval of 500 images over multiple pages (using the pagination functionality). 

ofxMetAPI Prototype 1.0

I am working on an OpenFrameworks add-on called ofxMet. 

ofxMet is an add-on for openFrameworks (v0.8.0+) that allows users to access the Metropolitan Museum of Art's API in C++. The add-on lets you pull data from the Met's digital collection such as image links and other information about an art piece.

Prototype I has incorporated the following functions:

  1. accessing Met API
  2. grabbing images based on search term
  3. pagination
  4. printing images to screen in a grid based on user defined grid size 
  5. scrolling 
Here is an example of searching "blue" in the Met's digital collection. 

Here is an example of searching "blue" in the Met's digital collection. 

Unfolding Maps in Processing

This is a continuation from my last blog post on earthquakes. 

I added more elements to the map:

  1. Full map (not just CA)
  2. Marker differentials based on magnitude
  3. A dropdown menu based on type of quake for UI
  4. Interactive sound - as user zooms in the sound becomes louder

I also attempted to use mouse-over labels on the data points but I struggled using "LabeledMarker.java" in the ControlP5 library from Processing. 

I also played with different methods for pulling data:

  1. Using csv file 
  2. Using Atom Syndication (link) and the RSSReader in Unfolding Maps 

METAMethods Proposal

Presentation is here.

Set Theory is a branch of mathematics that studies sets, or the collection of objects. In relation to Big Data, the cataloging and the creating of collections of information is where this project begins. Today, we experience this phenomenon in entirely new ways. Our whole life is cataloged and archived. Whether it be a tumbler page, an Instagram page, a digital folder of the images of your life, or a digital archive from the Metropolitan Museum of Art, everything today is both a singular data point, but also, when collected, becomes part of a set. And what defines any data point is the metadata that links it to that set of data.

<META> Methods attempts to extract beauty in the superset of information. This projects looks not at the individual (micro) but at the whole (macro) and attempts to find relationships, whether contextual, graphical or mathematical, by examining metadata.

This project also reimagines digital curation and asks the question: can a collection of digital assets become an asset, or work of art, in and of itself? Is metadata the “paint” that we can mix together, through algorithmic search, to create new “colors” in our digital “canvas”?

By applying mathematical theory to the analysis of a digital collection (set) of objects what new relationships can be uncovered and what new art can evolve? If you look at enough metadata, would you find that the set is self-similar (fractal)?

Bio Plastic Experiments 2.0

I am continuing to experiment with bioplasic. In this experiment I used Rockite and mixed it with the bioplastic to test the effects of the strength and drying. I also used the standard recipe to experiment with color and to try to make the material thinner and have a more uniform look to the material. 

2015-03-10 19.30.43.jpg

Earthquake Data Visualization

Growing up in California one of the biggest life-changing moments for me was the Loma Prieta 1989 Earthquake. So when thinking about this assignment I wanted to somehow capture the human impact of an earthquake. I did not want to just display data, but connect it to the (sometimes) horrendous nature of these events. 

I thought by incorporating sound of the visualization that would immediately connect the user to the human tragedy. I pulled a soundtrack from a YouTube clip of the footage from that day in 1989. For me that was the starting point for this assignment. 

Data Parsing:

I decided to look only at the California data because I wanted to do a project on my home state. 

I pulled the All_Month data from the USGS (http://earthquake.usgs.gov/earthquakes/feed/v1.0/csv.php) website and decided to look only at monthly data. 

I pulled the data into Excel to look at it and get a sense for what was going on. I ran some basic analytics on the data and realized that one county accounted for 22% of all earthquakes in the state of CA. 


I then wrote a script in Processing to parse the monthly data by the county "The Geysers" and only looked at "earthquake" data. Note that the full data file includes "explosions" and "quarry blasts". 

Once the data was parsed and I was only looking at "Earthquakes" from "The Geysers", I was able to get started with my visualization. 

I was very interested in using the Latitude and Longitude positions from the data tables. I used a library called Unfolding Maps that allowed me to easily make use of the positions through a function called "Location". 

I also spent some time looking into p5.js but I could not find a map library to use. I think for a future iteration of this type of visualization I would like to experiment with the Google Maps API or another maps library such as Leaflet (http://leafletjs.com/). 

http://a.parsons.edu/~florr422/DataViz/homework3/

I spent a lot of time having issues with my p5.js code until I realized that some functionality does not work unless you setup a local server. Please see my detailed README file here: http://a.parsons.edu/~florr422/DataViz/homework3/README.md

THE JPG EXPERIMENTS

The JPG EXPERIMENTS became an exploration in coding. I am inspired by Big Data, Geometry and Algorithms. I want to explore ways to express myself through the medium of code in these areas of interest. This project was really an exercise for me to answer this question: How can I use this inspiration to express myself artistically?

The first iteration and project proposal can be found in this blog post. 

Here is the presentation for this project.

I attempted to make a data visualization in OF and using ofxInstagram add-on. I actually found a bug in the add-on code so I was not able to complete my project using OF. But, I ended up working with the developer of this add-on to fix the bug.  

This is a screen shot of the broken code. The main bug has to do with the Instagram API limiting the images to 33 and needed pagination to complete the call.&nbsp;

This is a screen shot of the broken code. The main bug has to do with the Instagram API limiting the images to 33 and needed pagination to complete the call. 

I ended up using js to make this visualization. Here is the javascript code used to explore the Big Data section.

I also wanted to experiment with producing physical objects as an output of the screen-based code. I experimented with printing and laser cutting on paper and wood.  

Visual screen based outcomes:

Using particle systems to map color in images

Using particle systems to map color in images

Looking at big data and how to visualize

Looking at big data and how to visualize

Algorithmic art outputs (Sol Lewitt instruction, N=10)

Algorithmic art outputs (Sol Lewitt instruction, N=10)

Physical object outcomes:

Laser cutting using wood

Laser cutting using wood

Printed on transparency paper to play with light and installation ideas

Printed on transparency paper to play with light and installation ideas

Laser cutting using paper

Laser cutting using paper

With a light source behind image

With a light source behind image